
Fastest-Appreciating Neighborhoods in San Pablo, CA


The strongest appreciation among ranked San Pablo neighborhoods is 3.10%, in San Pablo, against a citywide average of 3.10%. 0 of 1 ranked neighborhood with an appreciation figure are above 10%.
Houseberry scores 1 San Pablo neighborhood on schools, safety, amenities, price, value and appreciation. Across the five nearest cities the average overall score is 3.1 out of 5, against 2.2 in San Pablo.
Learn more about San Pablo, CA.
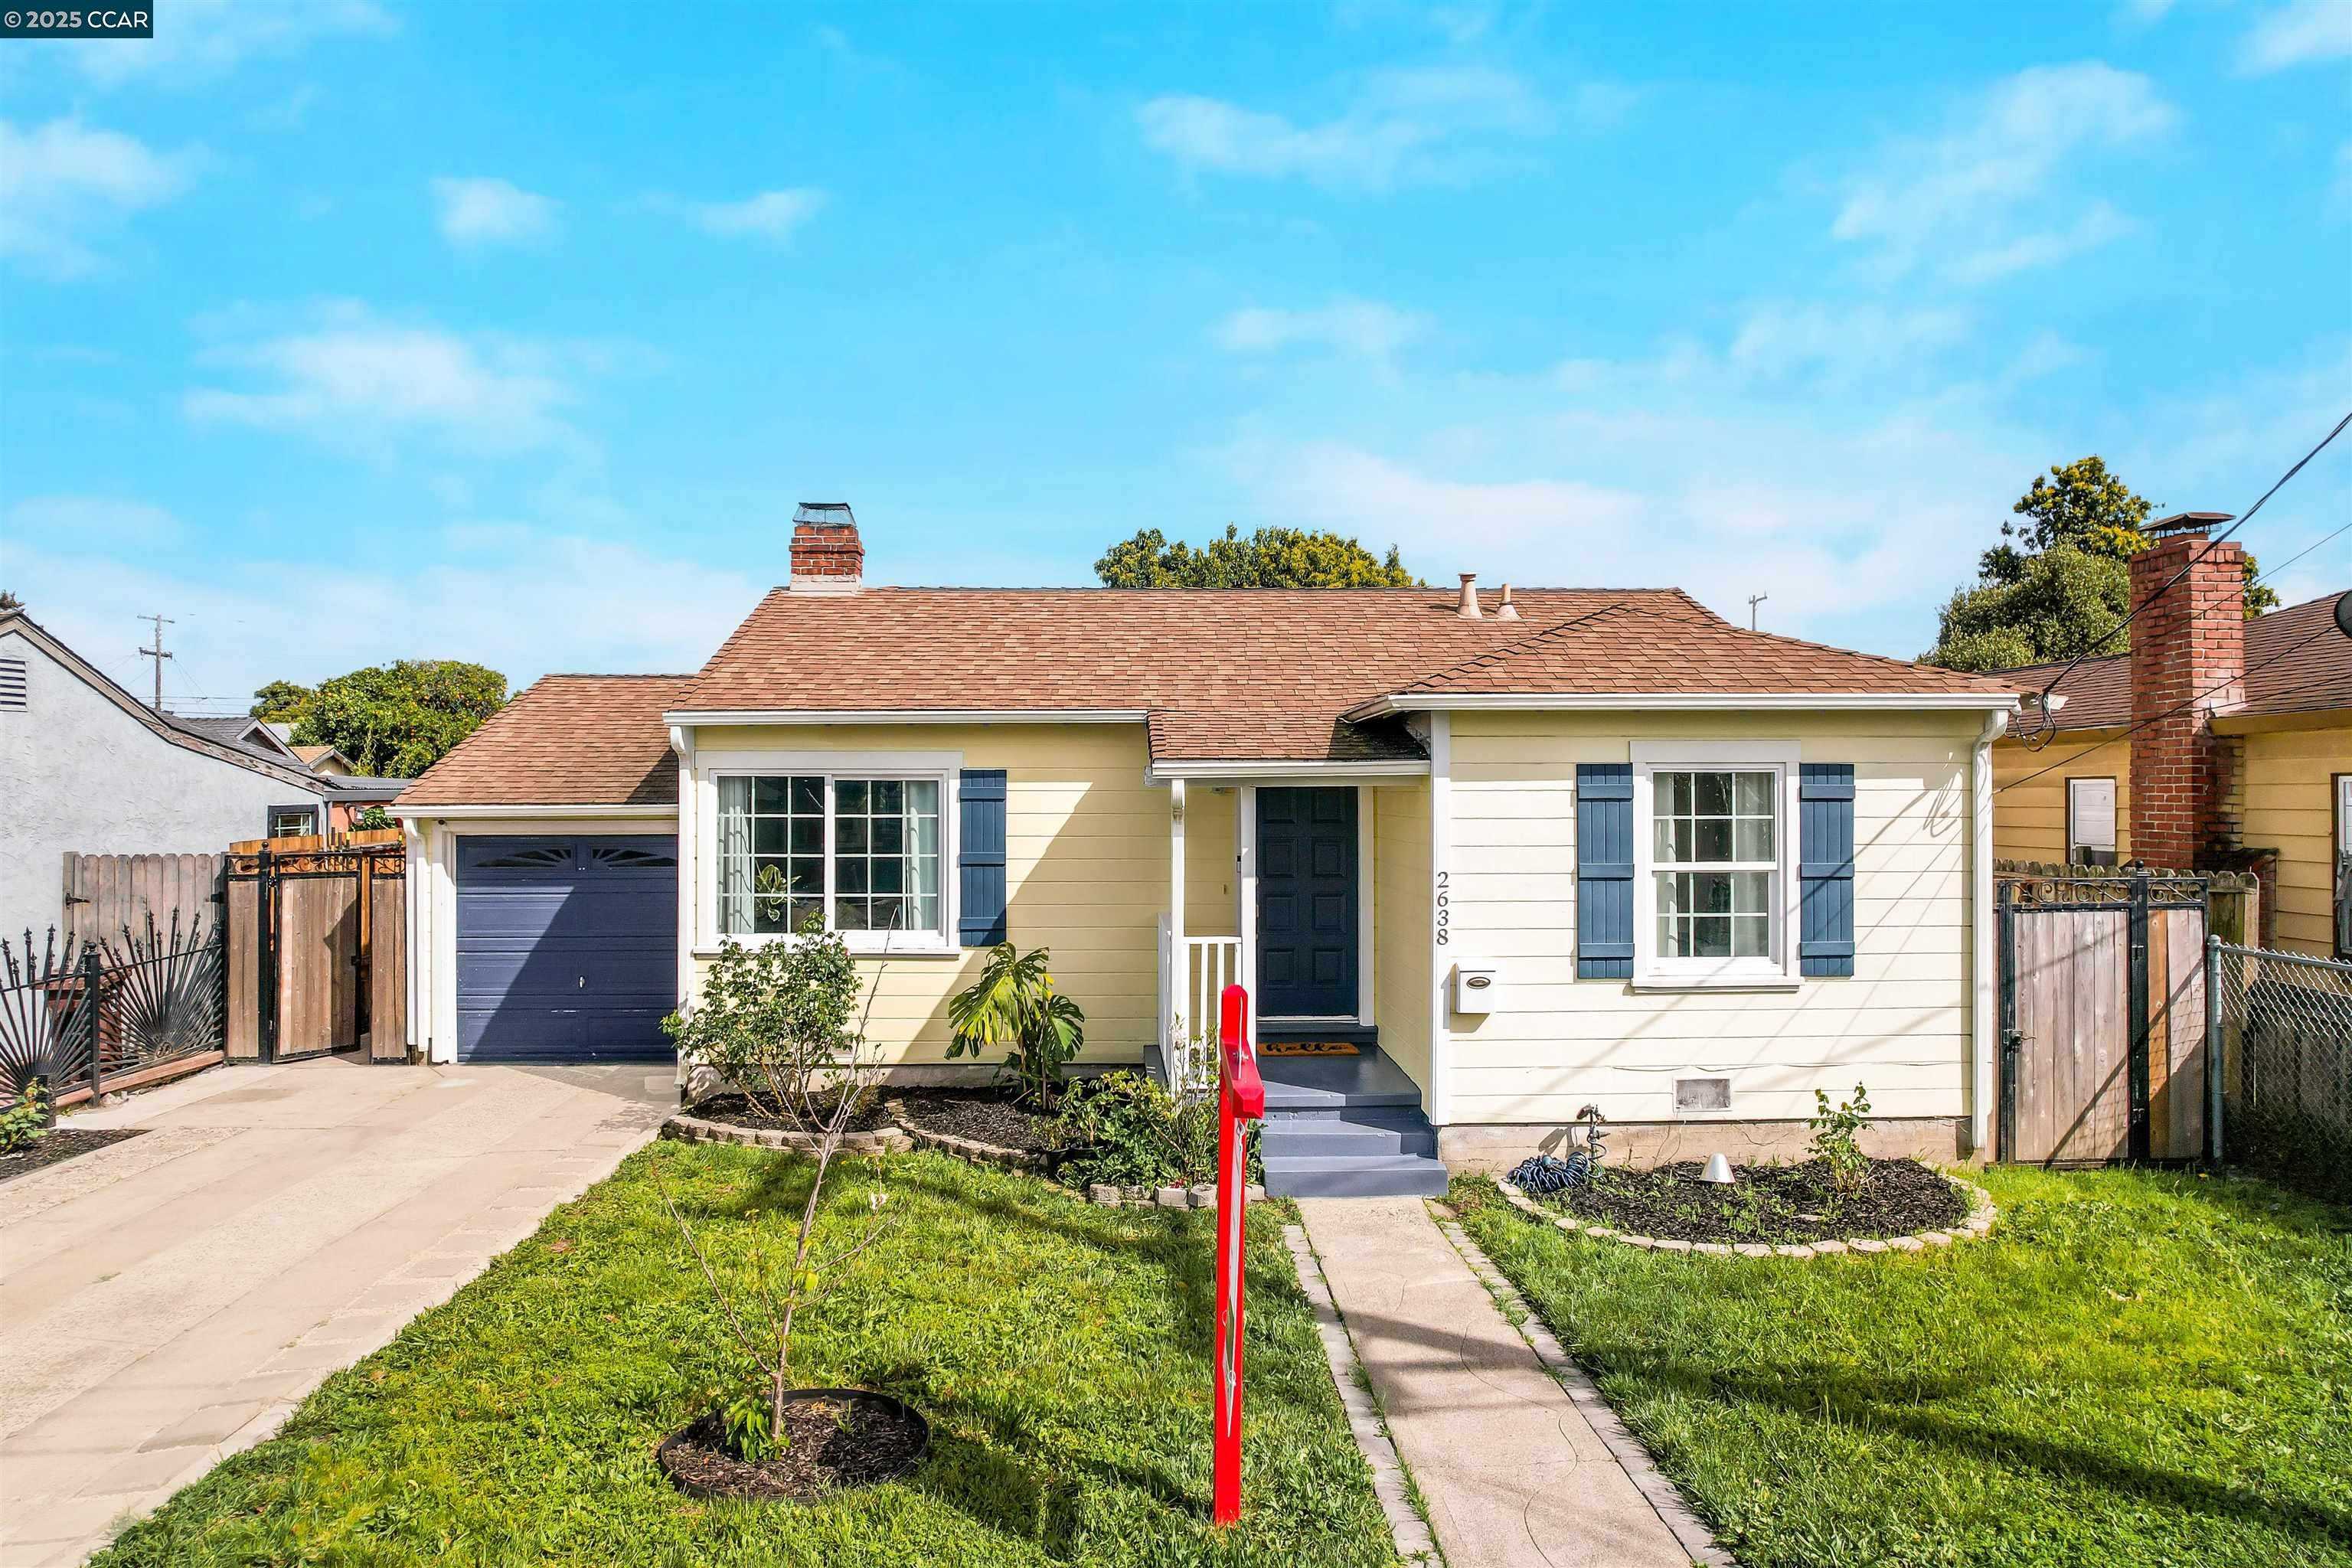
San Pablo, San Pablo, CA



Scores updated October 2026
Fastest-Appreciating Neighborhoods
Loading map...
View Full Map
San Pablo appreciation: your questions, answered
Which San Pablo neighborhoods have appreciated the most?
San Pablo has the highest appreciation in San Pablo, at 3.10%.
How much have home values risen in San Pablo?
Across 1 ranked San Pablo neighborhood, appreciation averages 3.10%. Individual figures run from 3.10% to 3.10%.
What do homes cost in San Pablo's fastest-appreciating neighborhoods?
The typical home price across the top 1 San Pablo neighborhood by appreciation is $547,183. San Pablo, with appreciation of 3.10%, has a typical home price of $547,183.
How many San Pablo neighborhoods have appreciated by more than 10%?
0 of 1 ranked San Pablo neighborhood with an appreciation figure has appreciated by more than 10%.
How does San Pablo home-price growth compare with nearby cities?
San Pablo neighborhoods average 3.10% appreciation. The nearest cities average Richmond 4.74%, Pinole 3.88%, El Cerrito -5.22%, Hercules 10.00% and Albany 17.60%.
More San Pablo rankings
- Best neighborhoods in San Pablo
- Best neighborhoods for schools in San Pablo
- Safest neighborhoods in San Pablo
- Best neighborhoods for amenities in San Pablo
- Most affordable neighborhoods in San Pablo
- Best-value neighborhoods in San Pablo
Zoom out
Nearby appreciation rankings
Richmond · Pinole · El Cerrito · Hercules · Albany