Bay Area Housing Goals: Nobody Here Is on Pace
Five California jurisdictions are on track to hit their state housing targets, and not one of them is a Bay Area city. Here is the scoreboard for the cities buyers actually shop, with prices next to it.

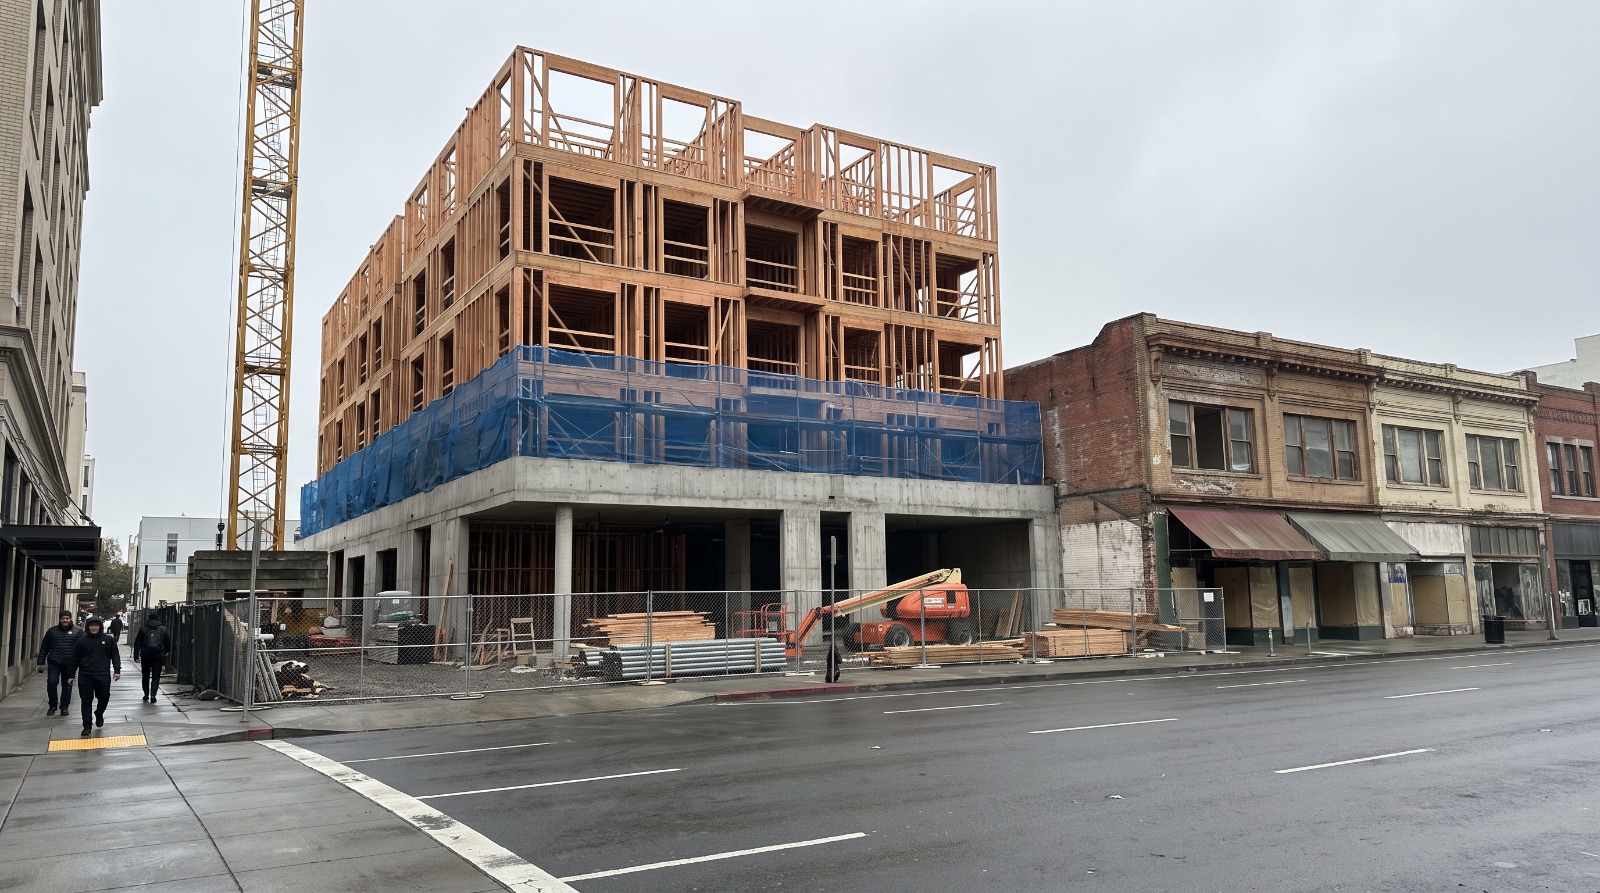
A mid-rise apartment building under construction in a Bay Area downtown, the kind of project the region needs far more of to meet its state housing goals Photo: Houseberry
Five California jurisdictions are on pace to hit their state housing targets across every income level. They are Plumas, Napa, Yolo and Mono counties, plus the city of Placerville, population about 11,000. No Bay Area city made the list. Not one.
That is the finding from CalMatters' August 11 analysis of state permit data, which got a second life this week when KALW republished it. The state told local governments to plan for roughly 2.5 million homes by 2030, about 312,500 a year. Statewide, 28.6 percent of jurisdictions are on pace for market-rate housing and 5.9 percent are on pace for very-low-income housing. Thirty-two out of more than five hundred.
What nobody has published is the version a Bay Area buyer can use: how far behind each city actually is, in units rather than adjectives, with what a house costs there sitting in the next column. So we built it.
Where the quota comes from
A quick word on the machinery, because the acronym does a lot of hiding. Every eight years the state decides how many homes California needs, splits that between regions, and hands the Bay Area's share to ABAG, the Association of Bay Area Governments. ABAG then divides it among 109 cities and counties. The result is the Regional Housing Needs Allocation, or RHNA, and it arrives as four separate numbers per city, one for each income level from very low up to market rate.
Two things about it get misread constantly. First, a city is required to zone for its allocation, not to build it. Nobody at city hall can force a developer to break ground. Second, progress is measured in permits issued, not homes finished, so every figure below is counting intentions that cleared a counter rather than keys handed over. Both caveats cut in the cities' favor, and neither one gets them off the hook, because zoning that produces nothing for eight years is a plan that failed.
The scoreboard
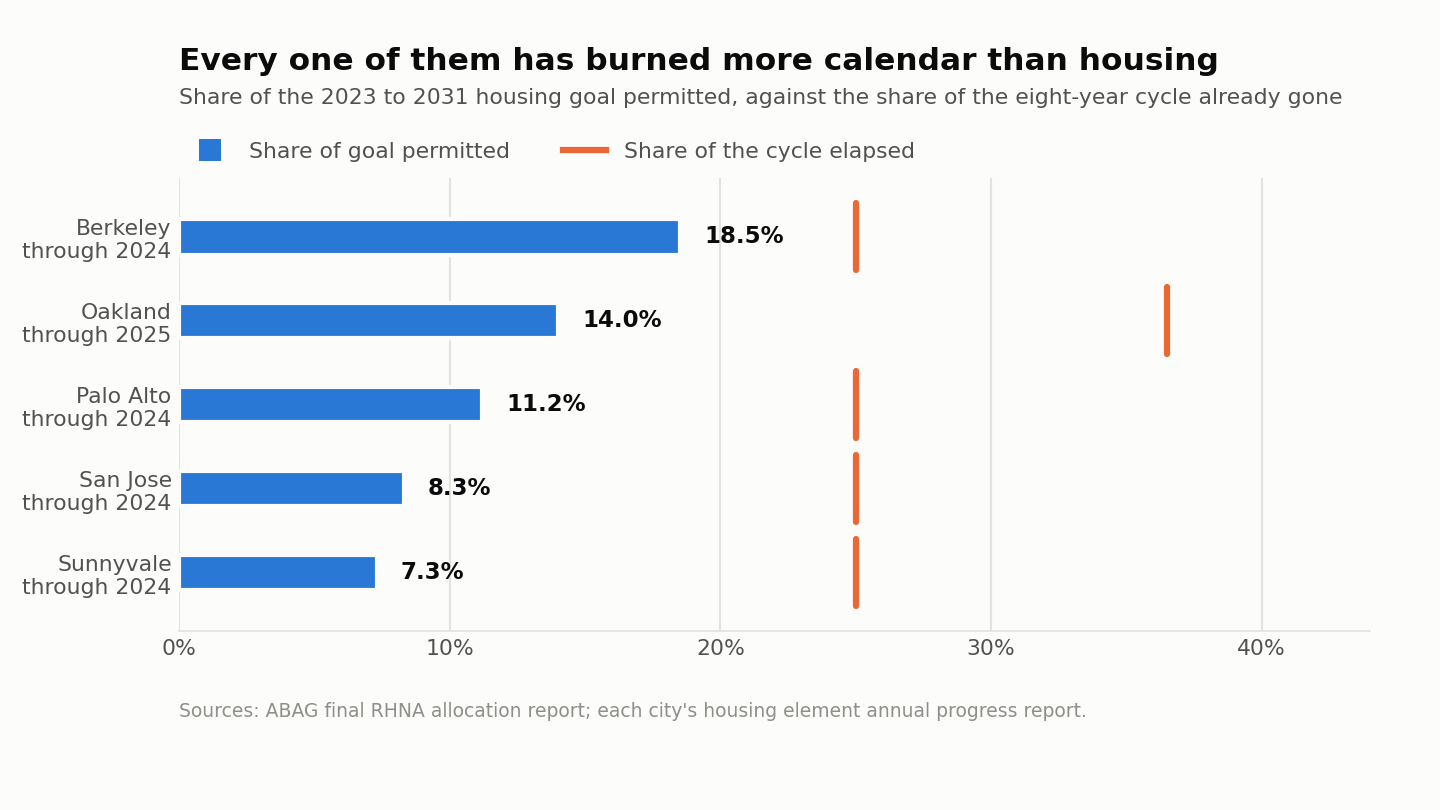
Every Bay Area city got an eight-year allocation covering January 2023 through January 2031, handed down by ABAG. Here are five of the region's biggest, with the number of homes each has actually permitted so far.
| City | 2023 to 2031 goal | Homes permitted | Share of goal | Median price |
|---|---|---|---|---|
| Berkeley | 8,934 | 1,654 (through 2024) | 18.5% | $1.77M (July 2026) |
| Oakland | 26,251 | 3,614 (through 2025) | 14% | $974,000 (July 2026) |
| Palo Alto | 6,086 | 680 (through 2024) | 11.2% | $3.9M (June 2026) |
| San Jose | 62,200 | 5,190 (through 2024) | 8.3% | $1.63M (July 2026) |
| Sunnyvale | 11,966 | 879 (through 2024) | 7.3% | $2.48M (July 2026) |
Goals come from ABAG's final allocation report. Permit counts come from each city's own annual progress report to the state, which is why the end dates differ by a year. Prices are current medians from Houseberry's city pages for Oakland, San Jose, Berkeley and Palo Alto, with the month stated because these move.
Now the comparison that makes those percentages mean something. By the end of 2024 the eight-year clock was about 25 percent run. By the end of 2025, about 36.5 percent. As of this week, roughly 45 percent. Read the table again against those numbers and the shape of it changes. Berkeley at 18.5 percent through 2024 is behind but in the game. San Jose at 8.3 percent is a third of where the calendar says it should be.
Oakland does the arithmetic on itself in its own report, and the result is bleak. To finish the cycle on target it would need to permit 4,528 homes a year for five straight years. Its best year so far was 1,028.
The split that surprised me
The statewide story is that market-rate housing is roughly on track and affordable housing is nowhere. In the Bay Area that pattern breaks, and it breaks differently in different cities.
| City | Very low income | Low income | Market rate |
|---|---|---|---|
| Berkeley | 6.5% | 4.8% | 36.7% |
| Oakland | 19% | 25% | 9% |
| Palo Alto | 9% | 6.1% | 15.7% |
| San Jose | 8.3% | 16.1% | 5.3% |
| Sunnyvale | 4.6% | 4.9% | 10% |
Berkeley is the textbook case: more than a third of its market-rate goal delivered, under 5 percent of its low-income goal. Oakland and San Jose are the reverse. San Jose has permitted 5.3 percent of its market-rate goal, its single worst category, which is the opposite of what the statewide numbers would predict. Oakland has permitted a quarter of its low-income goal and less than a tenth of its market-rate one.
The plain reading is that Oakland and San Jose are not being blocked by their own politics so much as by their own math. Market-rate apartments only get built when rents clear construction costs and interest rates, and in those two cities right now they mostly do not. Affordable units, by contrast, get built when a subsidy shows up. Two different machines, both stalled, for two different reasons.
What actually happens to a Bay Area city that misses its housing goal
Less than most people assume, and not on the schedule people assume either.
Falling behind on permits does not, by itself, cost a city anything. The penalty attaches to losing housing element compliance, which is a paperwork status, not a production score. All five cities in the table above currently hold a certified housing element.
What that certification protects against is the builder's remedy, the rule that lets a developer propose housing that ignores local zoning in a city out of compliance. AB 1893 rewrote it effective January 2025, and the trade was real: developers now need far less affordability to qualify, as little as 10 percent very-low-income, in exchange for having to respect zoned density limits. It is a tool a developer chooses to pick up, not a punishment the state hands down.
Revocation is real too, and it happens for the same reason every time. The state pulled Rocklin's compliance finding in June 2025, and La Puente's in October 2025, both for missing rezoning deadlines, not permit counts. That is the honest version of the enforcement story. Sacramento punishes cities that fail to zone. It does not really punish cities that zone and then watch nothing get built.
The clearest illustration landed three days ago. On August 22 the state awarded $11.3 million to thirteen prohousing-designated communities, and one of them was Sunnyvale, which sits at the bottom of the table above. Sunnyvale is being paid for adopting good housing policy while permitting 7.3 percent of its goal. Both things are true at once, and the gap between them is the whole problem in one line item.
Does any of this move prices? Carefully
This is where housing coverage usually oversells, so here is the honest version.
A single city's permit count is a weak predictor of that city's median next year. Walnut Creek has among the region's worst affordable-housing progress, at 4.6 percent of its very-low-income goal, and a median around $1.53 million as of June 2026. Concord, one freeway exit away in the same county, has permitted 45.4 percent of its low-income goal and has a median around $824,600 as of July 2026. The gap between those two cities is not explained by their permits. It is explained by what those two places already were.
The research supports something narrower and more durable. California's Legislative Analyst put the state's long-run shortfall at 70,000 to 110,000 homes a year between 1980 and 2010, with San Francisco and San Jose growing their housing stock 0.7 percent annually against Seattle's 1.4 percent. That accumulated gap is a principal reason a starter home here costs what it costs. New buildings do measurably help nearby, and modestly: a study of San Francisco construction found rents about 2 percent lower within 100 meters of new market-rate housing, with the effect fading to nothing by a mile.
So the fair sentence is this. Nobody should tell you Sunnyvale's median is $2.48 million because Sunnyvale permitted 879 homes. What is true is that the region has been running this deficit for forty years, the current pace is not closing it, and the effect of that shows up in the price level rather than in any single year's chart.
How to use the scoreboard when you are house hunting
Two practical reads, and they point in different directions.
If you are buying to stay a long time, a city that is badly behind and badly out of compliance is a city where the rules can change under you, sometimes fast. The builder's remedy exists precisely to override local zoning, and a project you never saw coming is a real possibility on a corner lot near you. Check the compliance status, not the permit count.
If you are buying in the next few years and you care about supply arriving, the cities worth watching are the ones where the pipeline is visibly moving regardless of the scoreboard. San Mateo's 847 homes approved at 690 Concar Drive is one project worth more than a year of most cities' output. That is how this actually gets closed, in big awkward chunks on old shopping center parcels, not evenly across eight years.
The trade-off nobody enjoys: those chunks land somewhere specific, and the somewhere is usually a neighborhood that did not ask for it. Every honest supply argument has to carry that. We spend a lot of time at Houseberry looking at how a specific block scores before we look at a specific listing, and this is one of the reasons. The regional numbers tell you the shortage is real. Only the neighborhood numbers tell you what a given corner is about to become.
Watch for the next round of state progress reports in the spring. That is when the 2025 numbers land for everybody, not just Oakland, and the table above gets its first honest year-over-year comparison.
Sources
CalMatters: Almost nowhere in California is building enough, according to the state
KALW: Few California municipalities have met new housing goals
ABAG: Final RHNA allocation report, 2023 to 2031
City of Oakland: 2025 housing element annual progress report
City of Berkeley: 2024 housing element and general plan annual progress reports
Bay Area Equity Atlas: Bay Area housing readiness report
Legislative Analyst's Office: California's high housing costs, causes and consequences
California HCD: Rocklin housing element compliance revocation, June 2025
The Houseberry Research Team is Houseberry's reporting team: Bay Area real estate analysts, data specialists and longtime local market watchers. Every day we check the public record: building permits, city council and planning agendas, county recorder filings, state housing bills, police incident data and school results. Then we tie each story to what it means for specific neighborhoods, using Houseberry's own neighborhood data on prices, appreciation, safety, schools and amenities. Questions or corrections: Contact us.
All information provided on this website including but not limited to - school ratings, safety, amenities, user opinions, and property data - is for general informational purposes only. We do not guarantee its reliability, accuracy, or completeness. Users should independently verify information and consult appropriate professionals as needed. By using this website, you agree Houseberry is not responsible for actions, decisions, or consequences arising from reliance on the information provided
houseberry.com - CA DRE# 01847391
 Bay East ©2025. CCAR ©2025. bridgeMLS ©2025. Information Deemed Reliable But Not Guaranteed. This information is being provided by the Bay East MLS, or CCAR MLS, or bridgeMLS. The listings presented here may or may not be listed by the Broker/Agent operating this website. This information is intended for the personal use of consumers and may not be used for any purpose other than to identify prospective properties consumers may be interested in purchasing. Data last updated at October 9, 2026 12:00 AM