

Sterling Downs, Belmont, CA




Sterling Downs at a Glance
Sterling Downs is ranked #8 of 9 neighborhoods in Belmont with an overall score of 3.9/5. Its standout factors are schools (4.9/5, 7th of 9 in Belmont) and nearby merchants (3.6/5), at a typical home price of $1.97M, which Houseberry currently rates as undervalued by about $105,000. The trade-off is safety (2.9/5), though prices run about 16% below the Belmont typical home price.
Sterling Downs Reviews & Questions

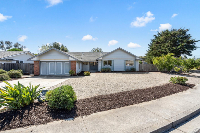
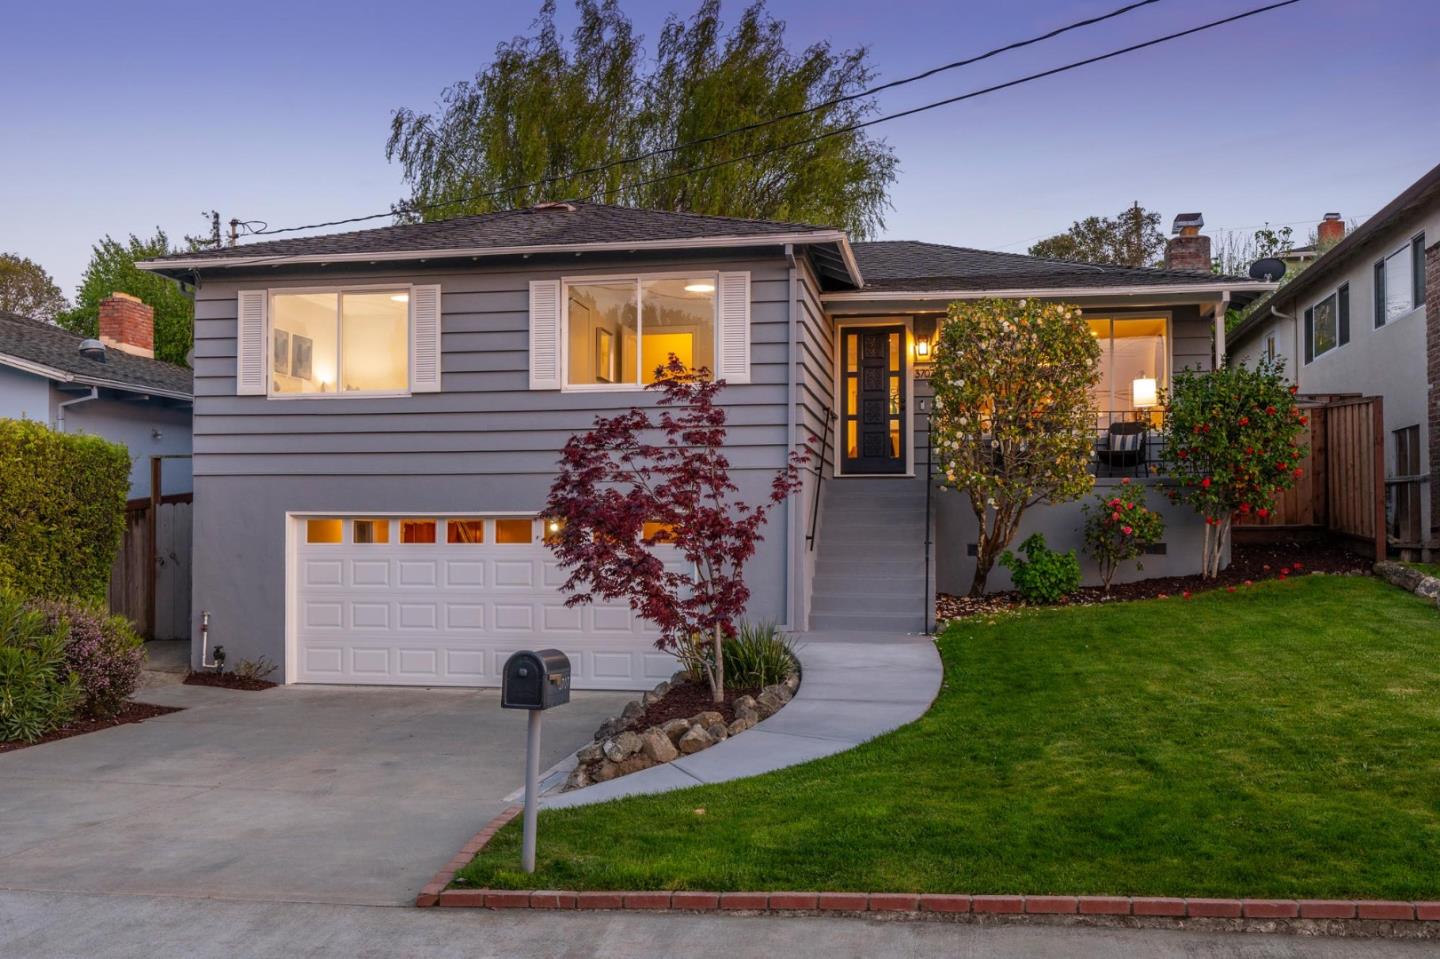
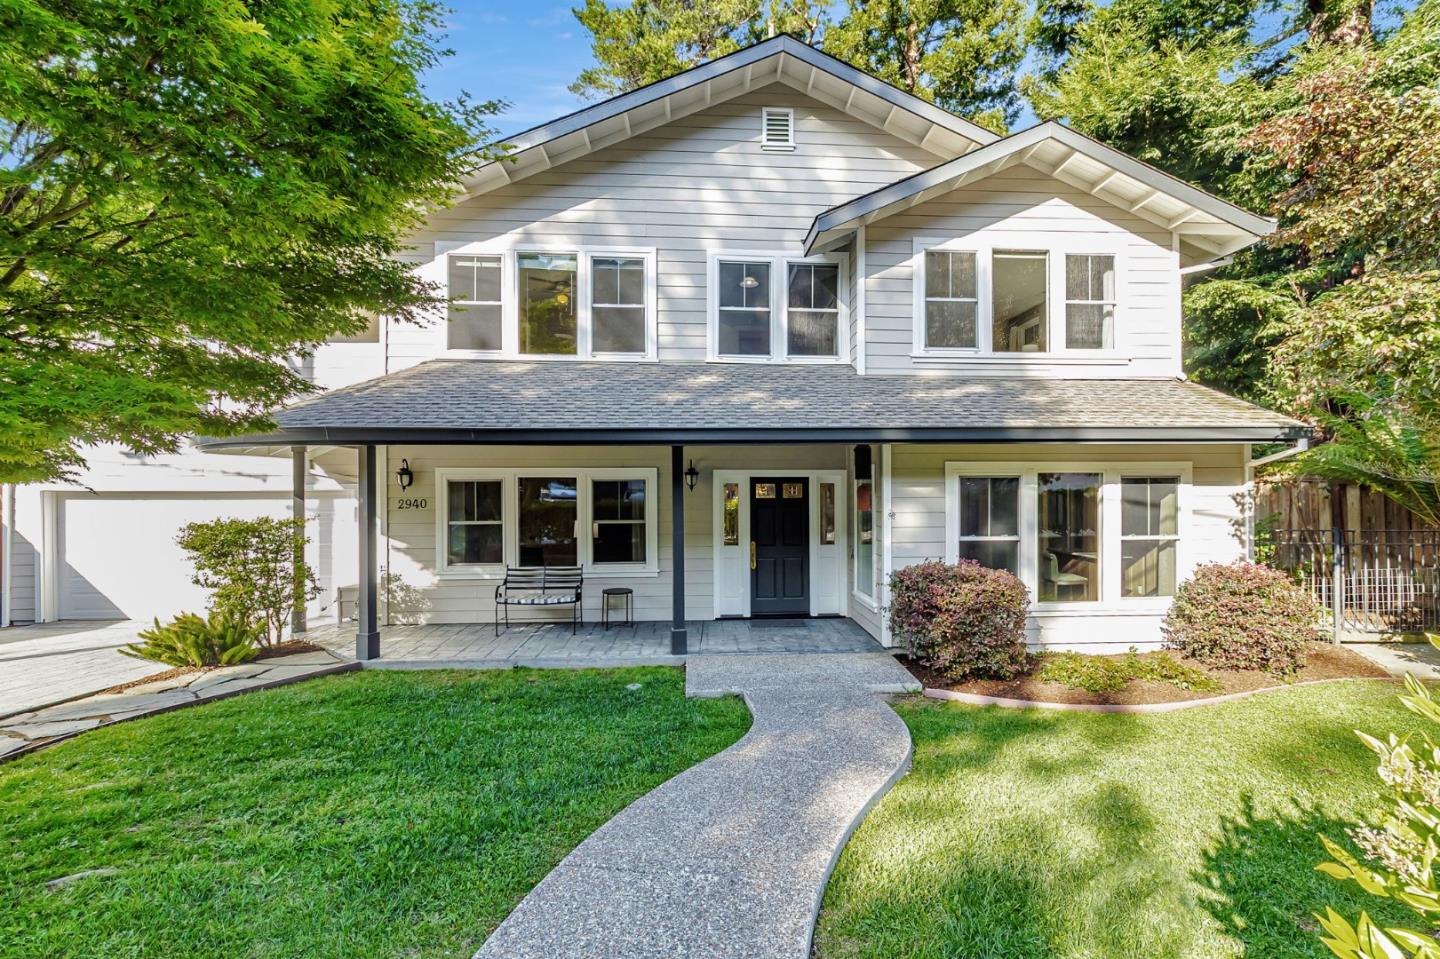
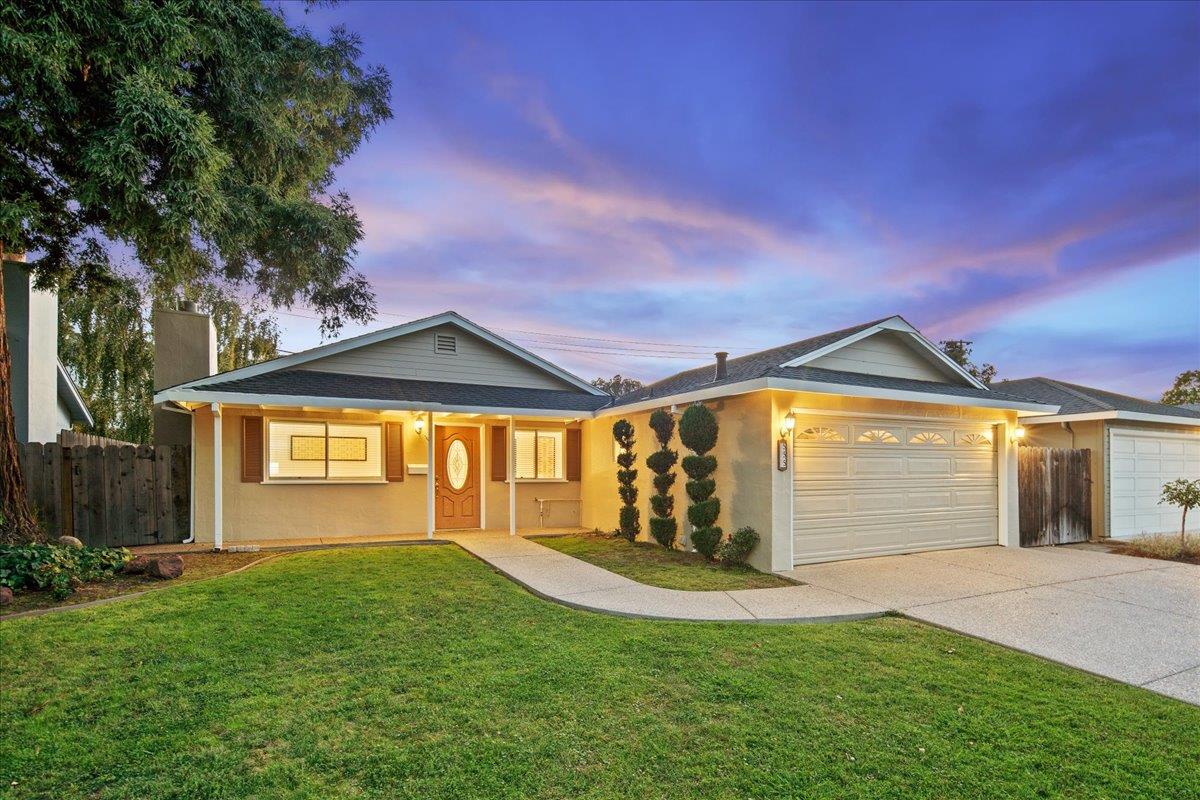
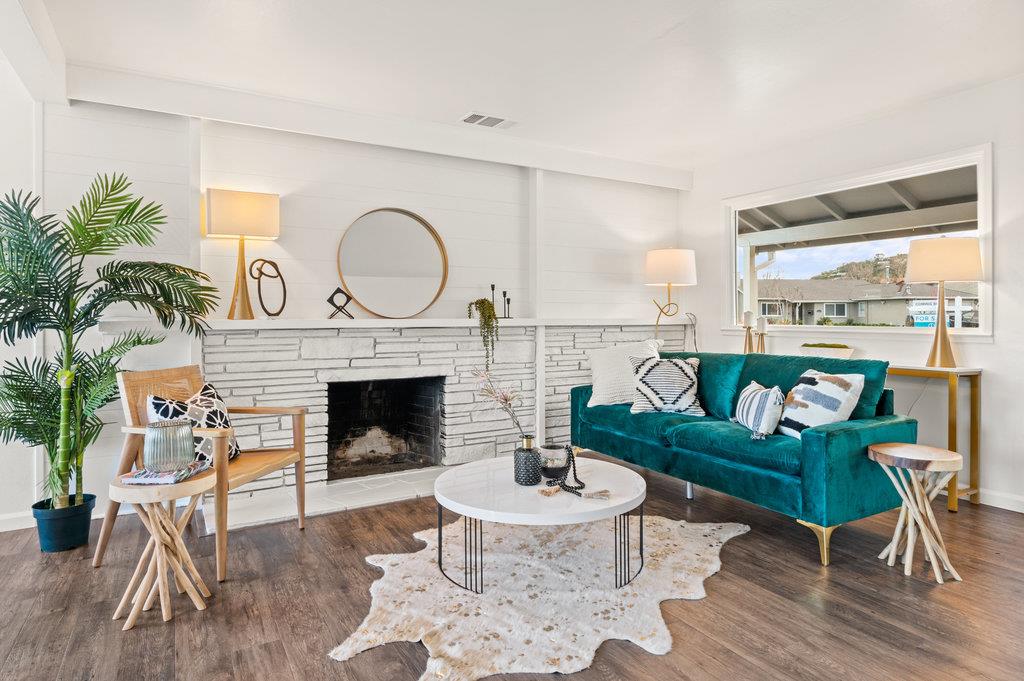
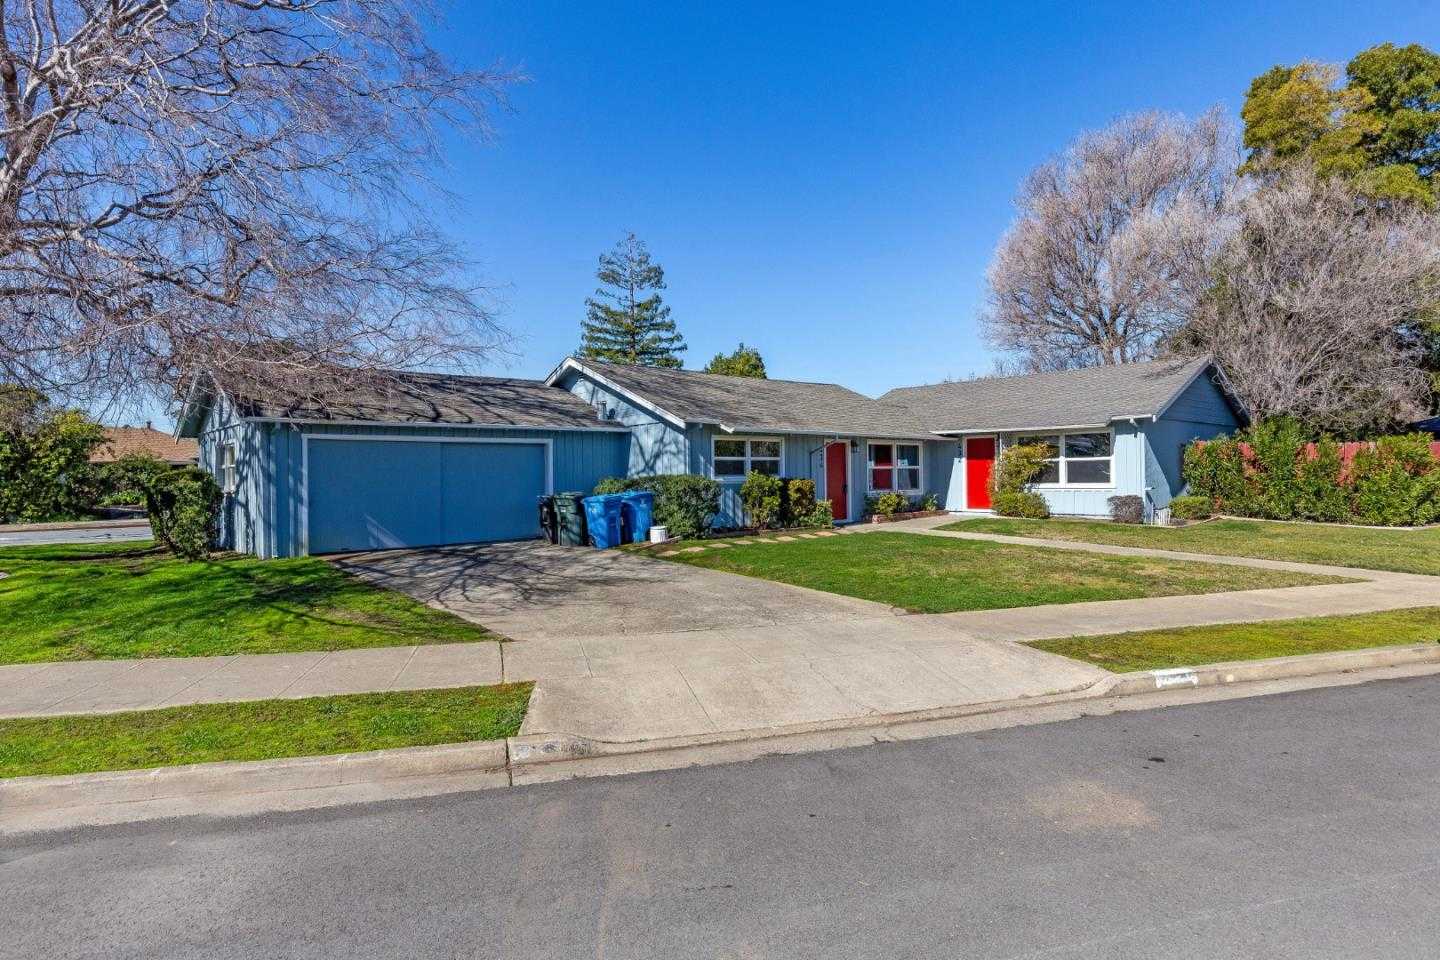
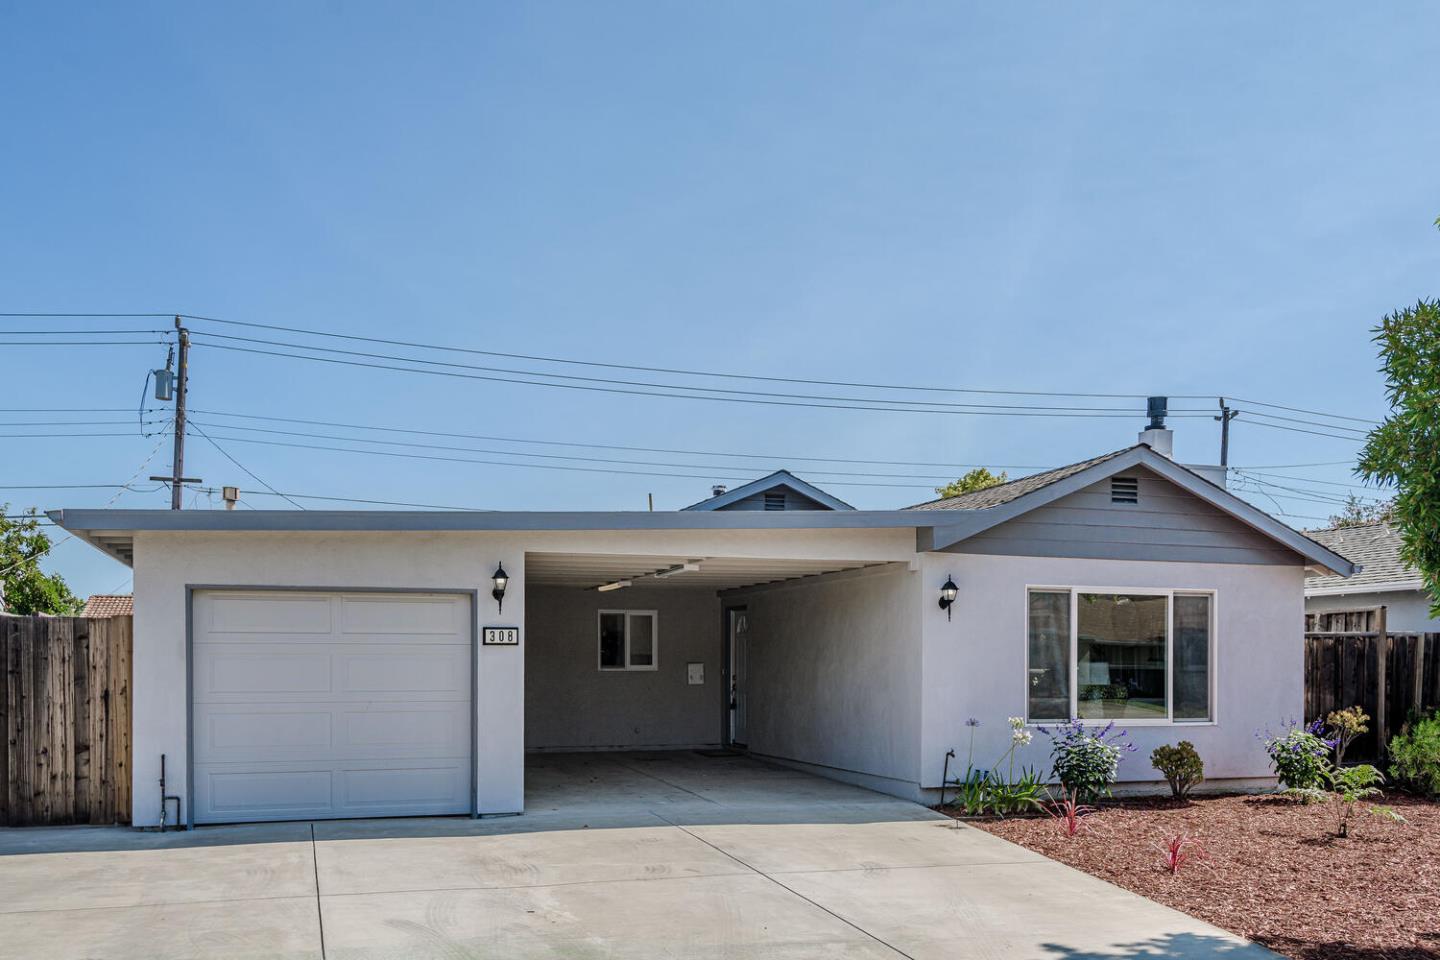
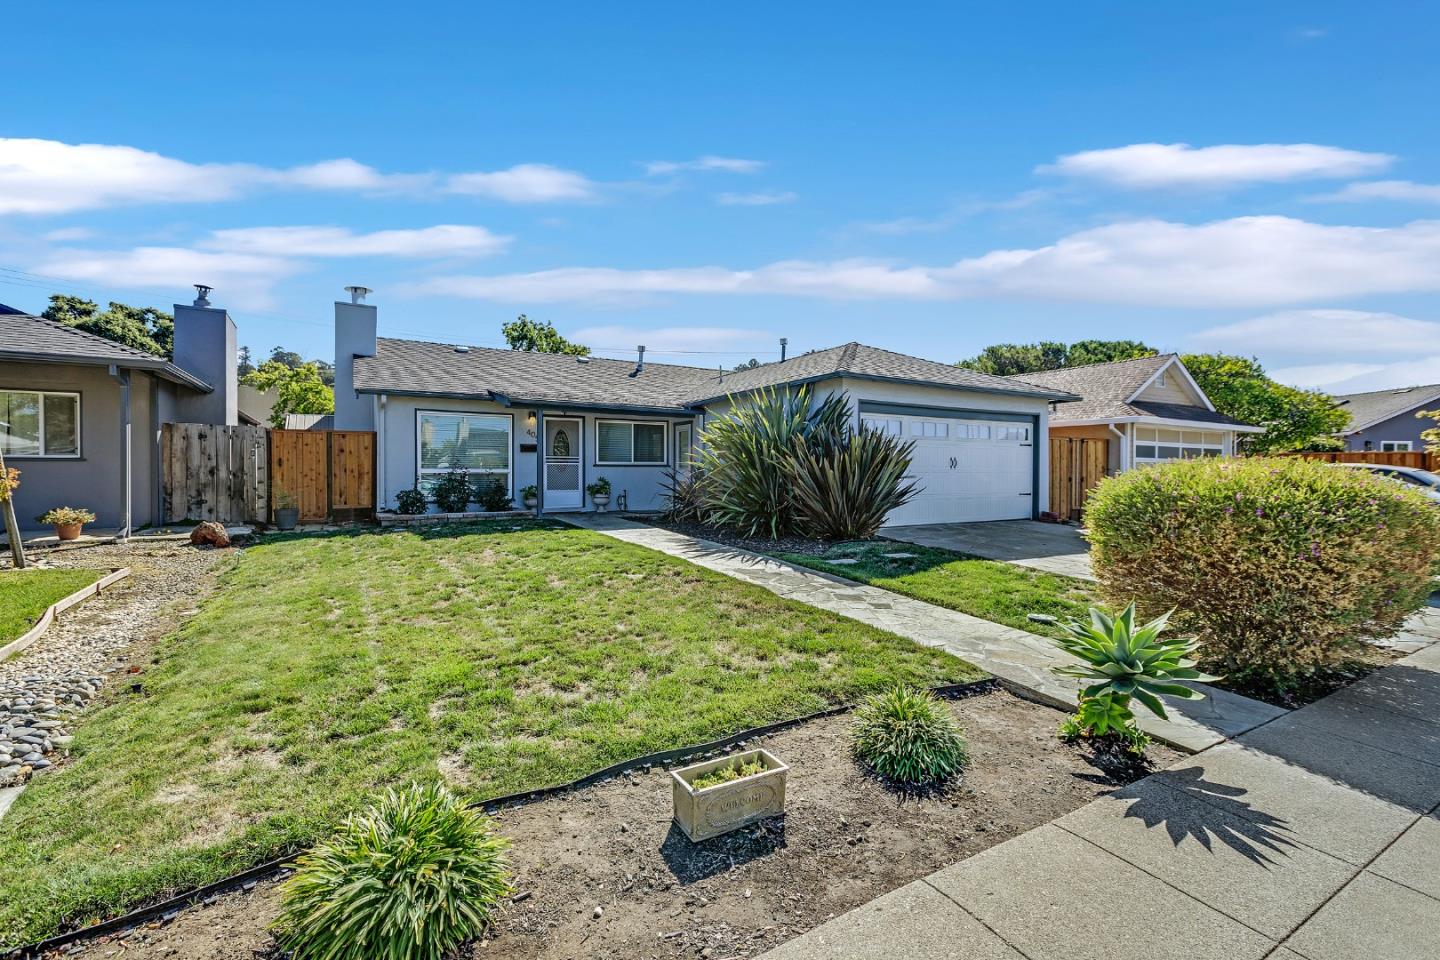
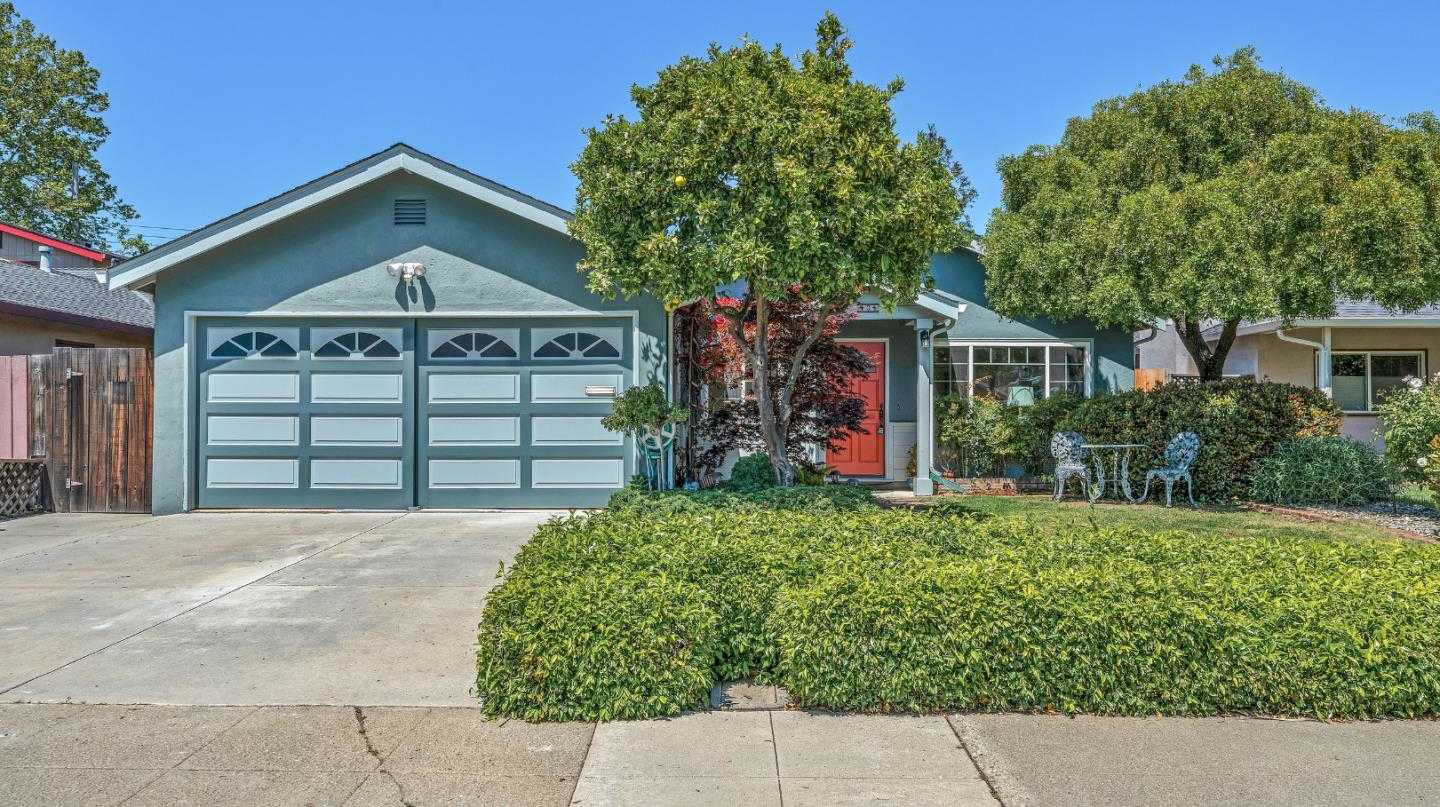
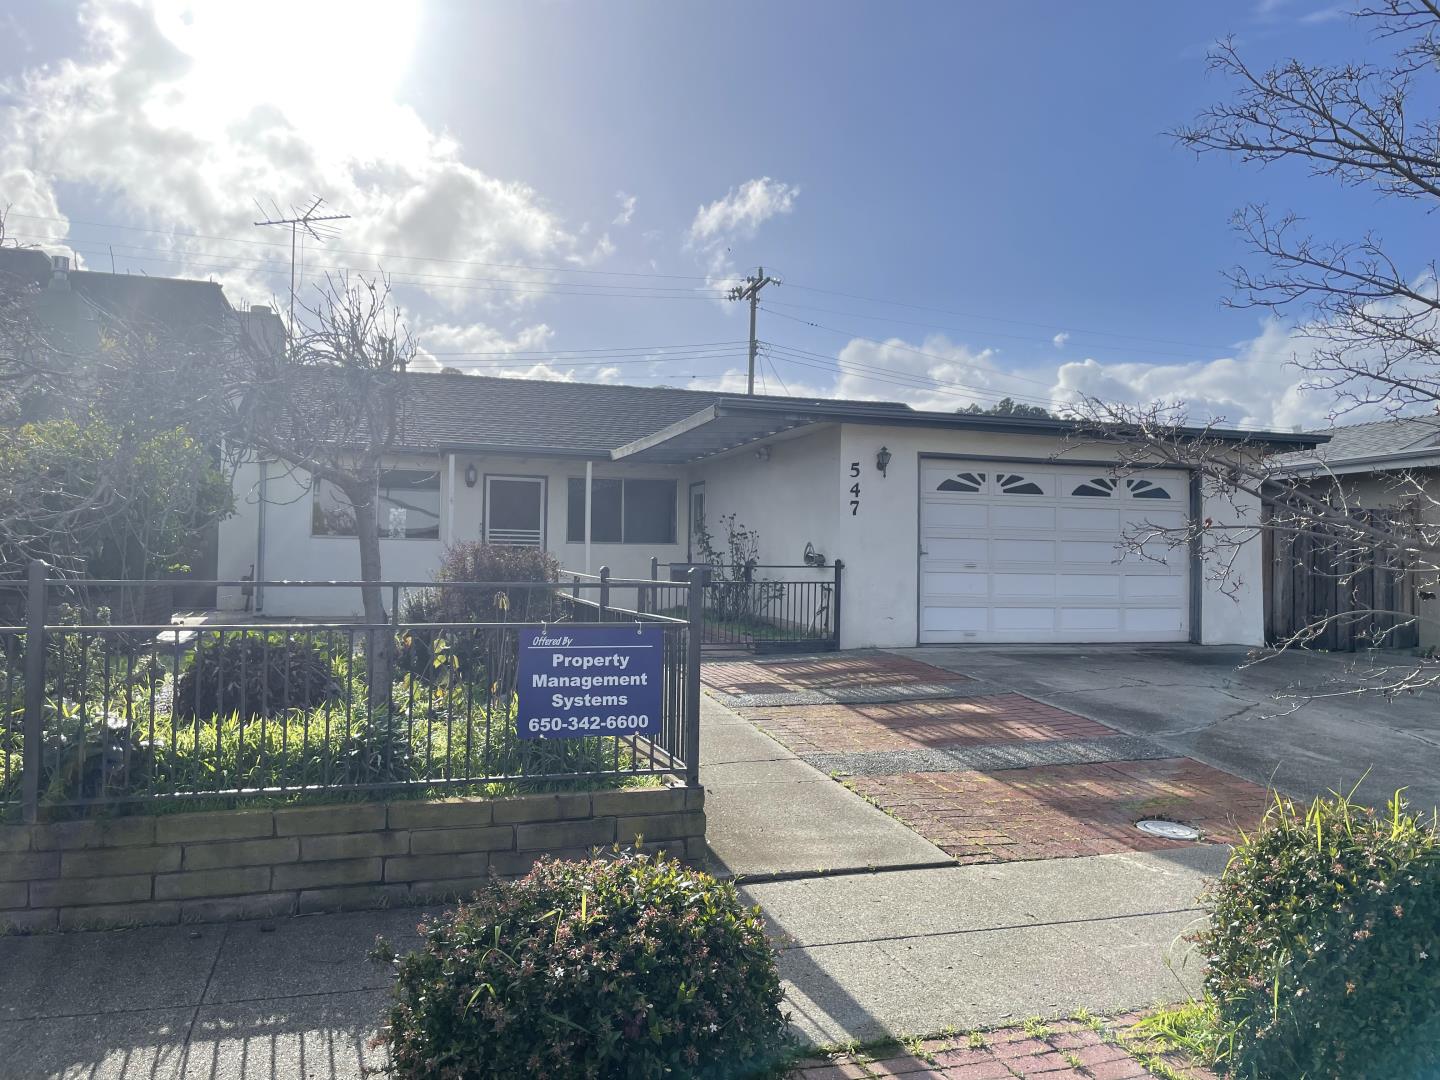
The housing in Sterling Downs primarily consists of single-family homes built around the 1950s and 1960s, with some apartments mixed in. The architectural styles are largely Ranch and Mid-Century Modern, lending the neighborhood a timeless, classic feel. These homes often come with yards that are well-manicured, underscoring the community's pride in curb appeal. It is also one of the flattest neighborhoods in Belmont, offering easy walkability. One downside worth mentioning is that the neighborhood is close to the 101 highway, which could be a noise concern for some residents. However, this proximity also makes it convenient for commuting, striking a balance between suburban life and accessibility to work or other activities.
Top Neighborhoods in Belmont, CA


Sterling Downs Amenities
 Near good merchants
3.6
 Public Spaces
3.5
 Curb Appeal
3.5
Overall Amenities score: 3.5
Sterling Downs Weather
Sterling Downs Photos
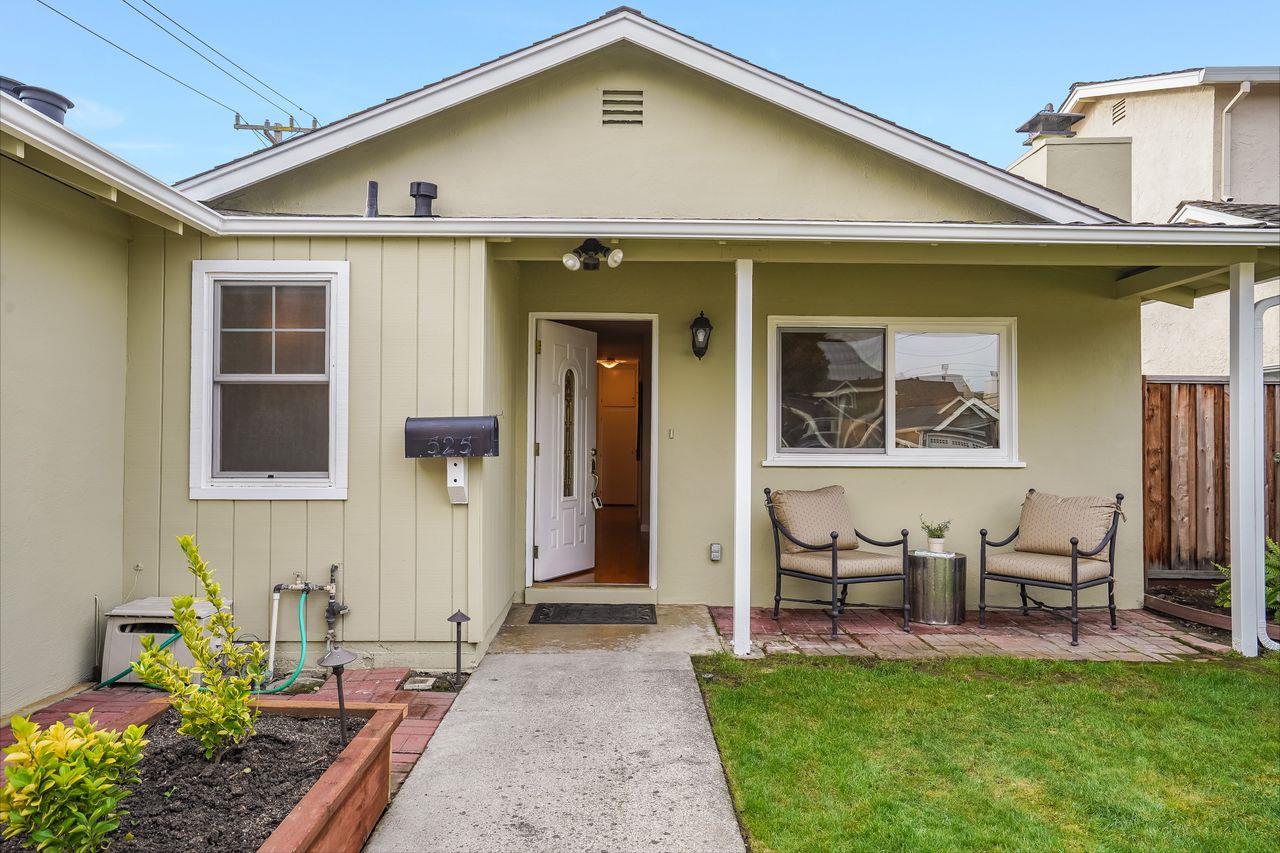
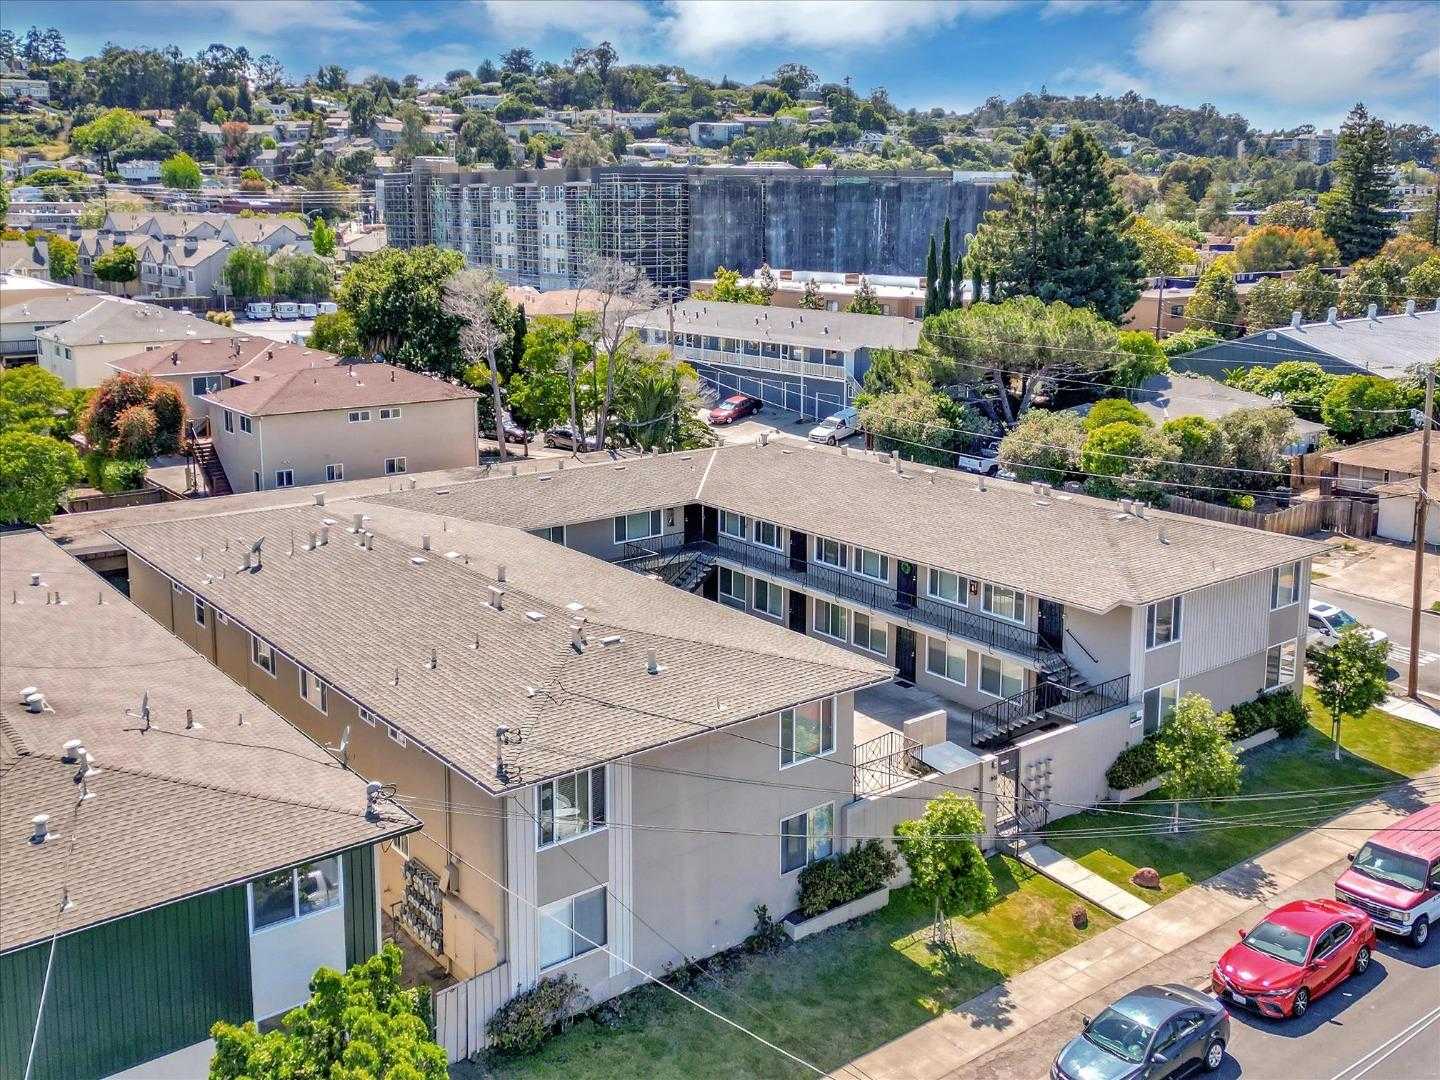
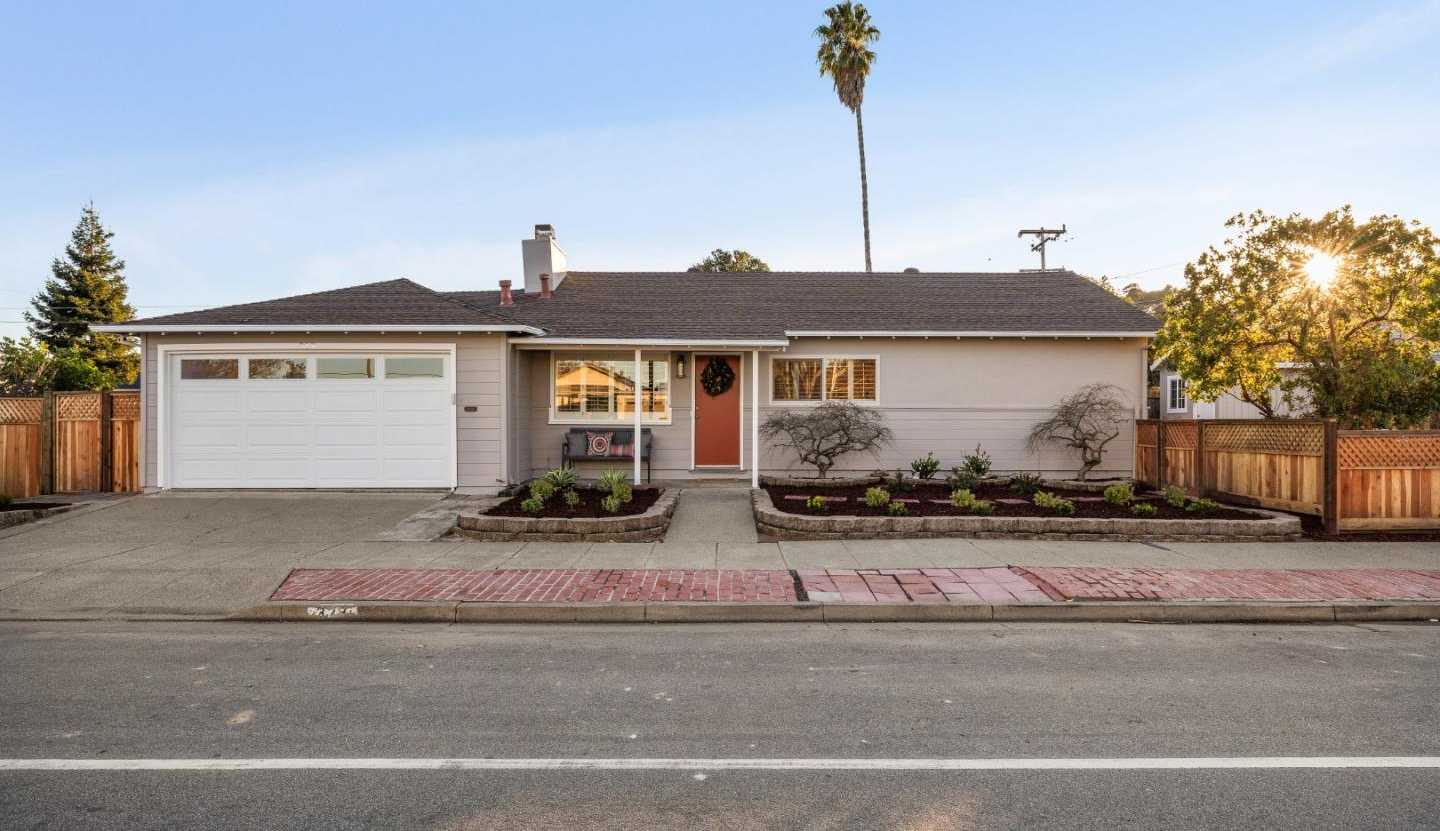
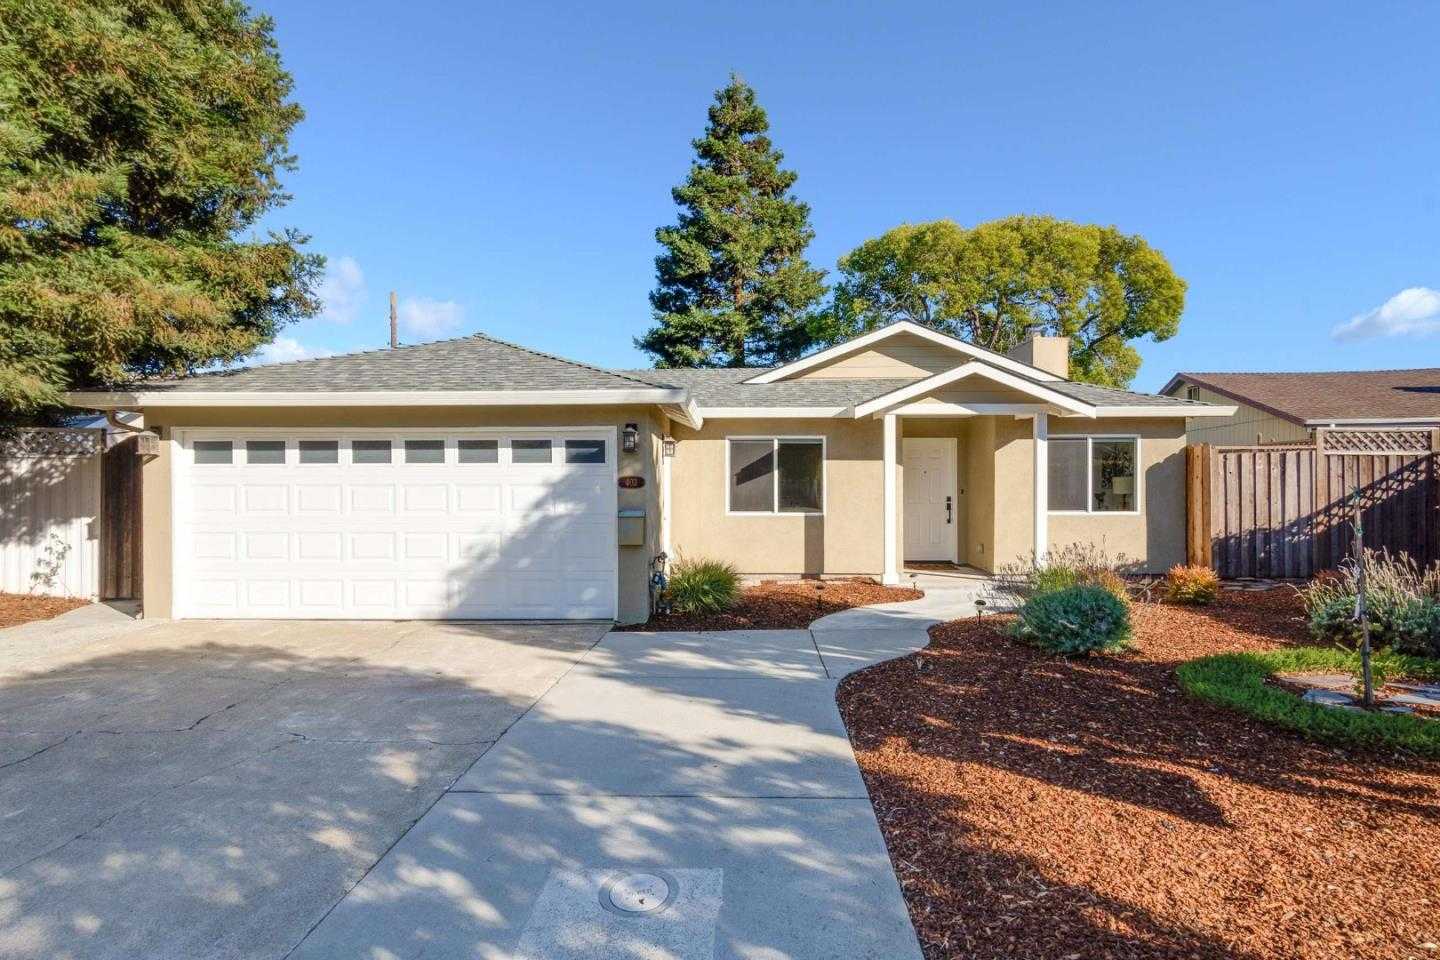
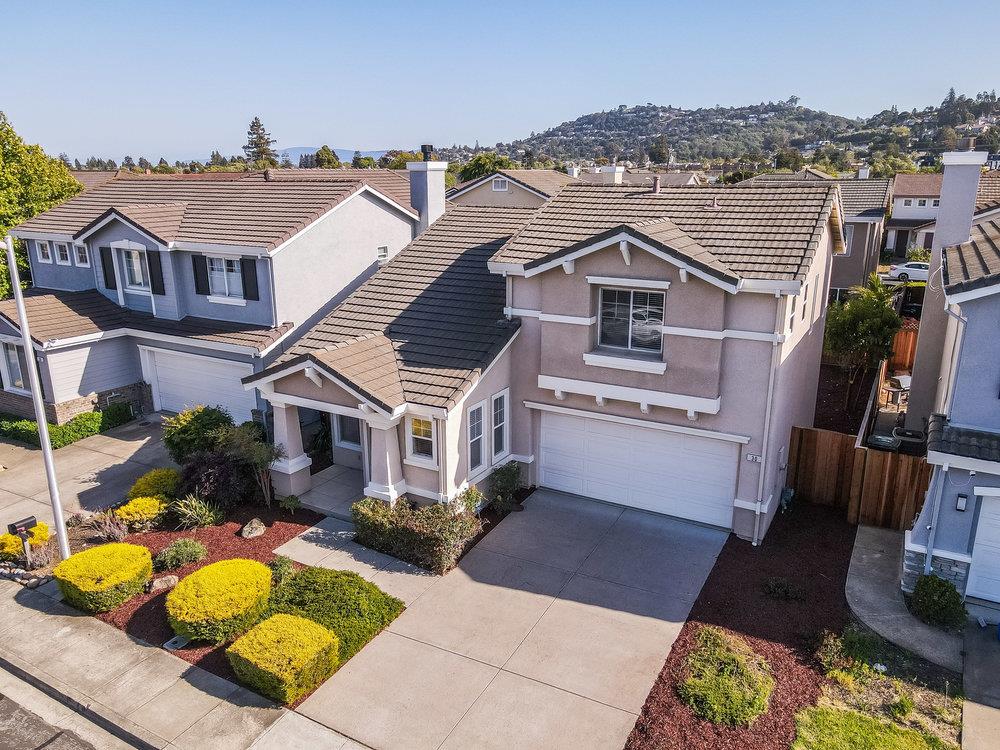
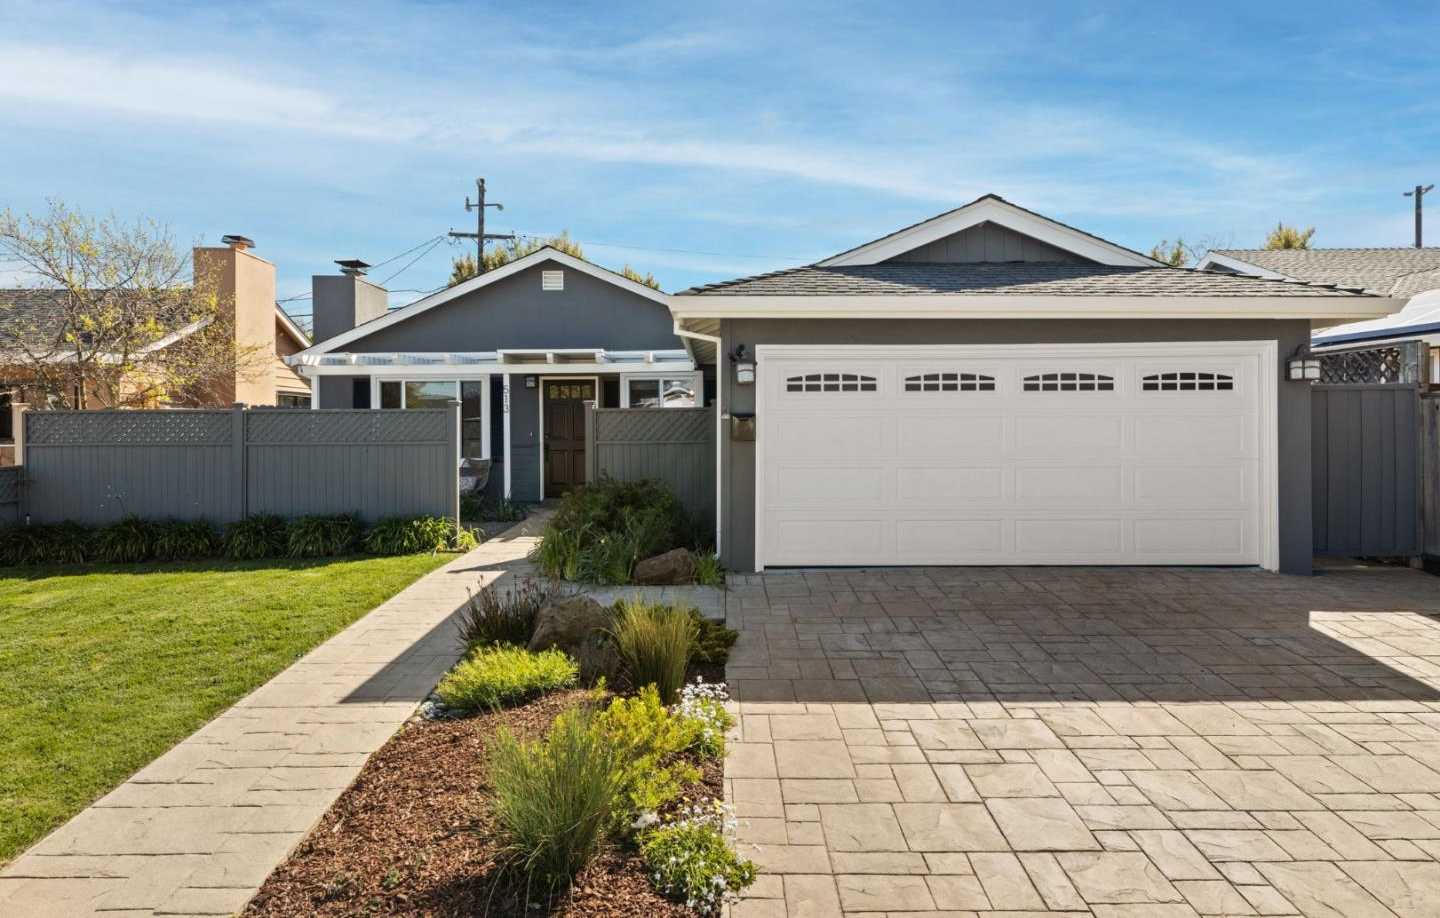
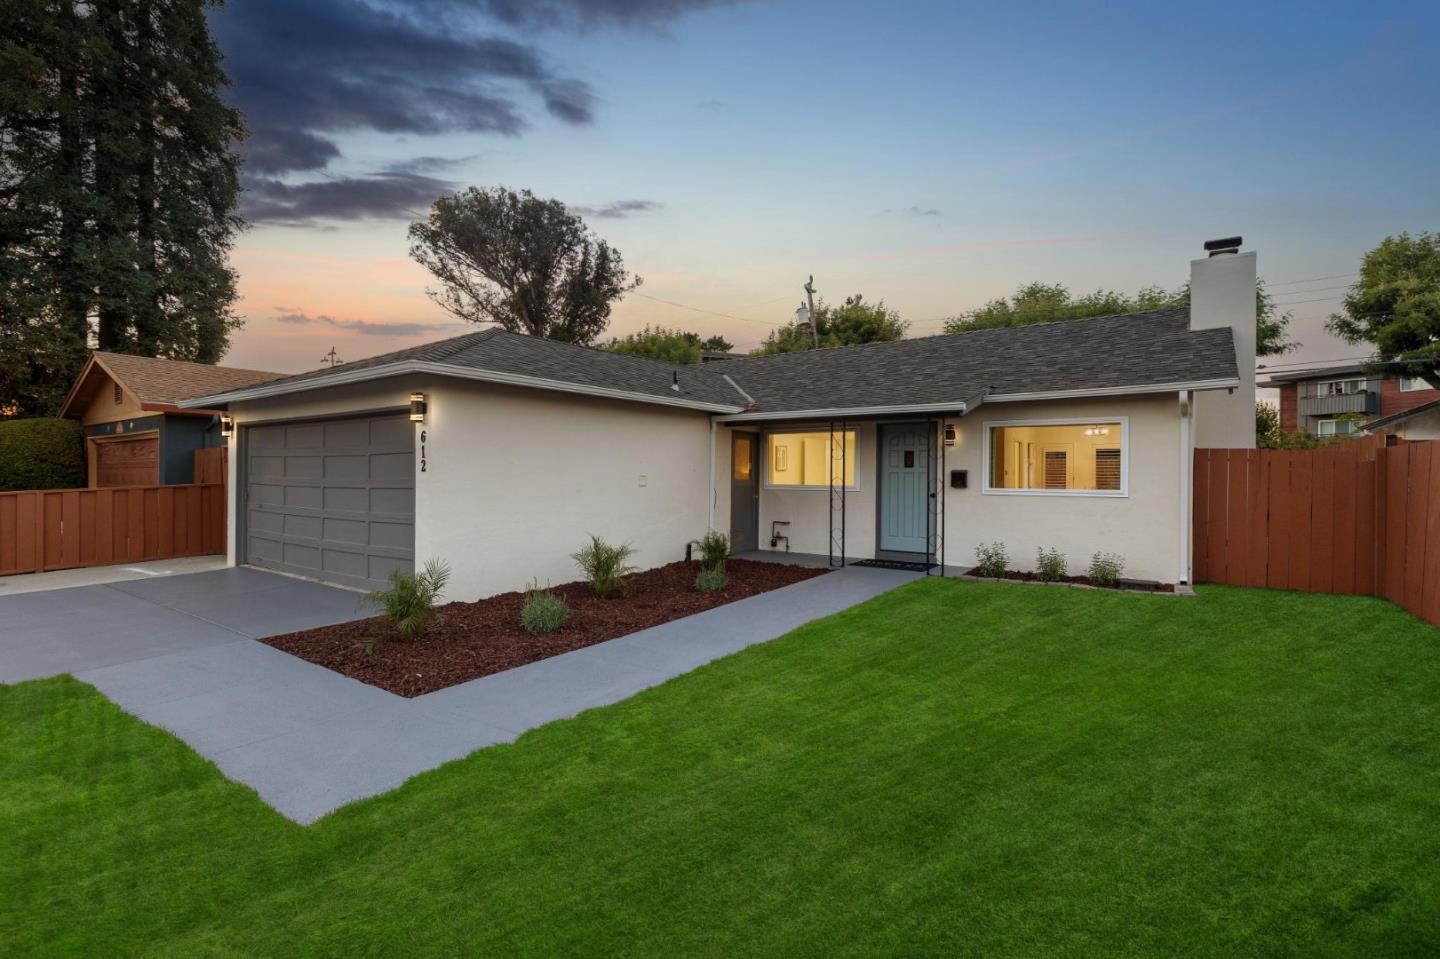
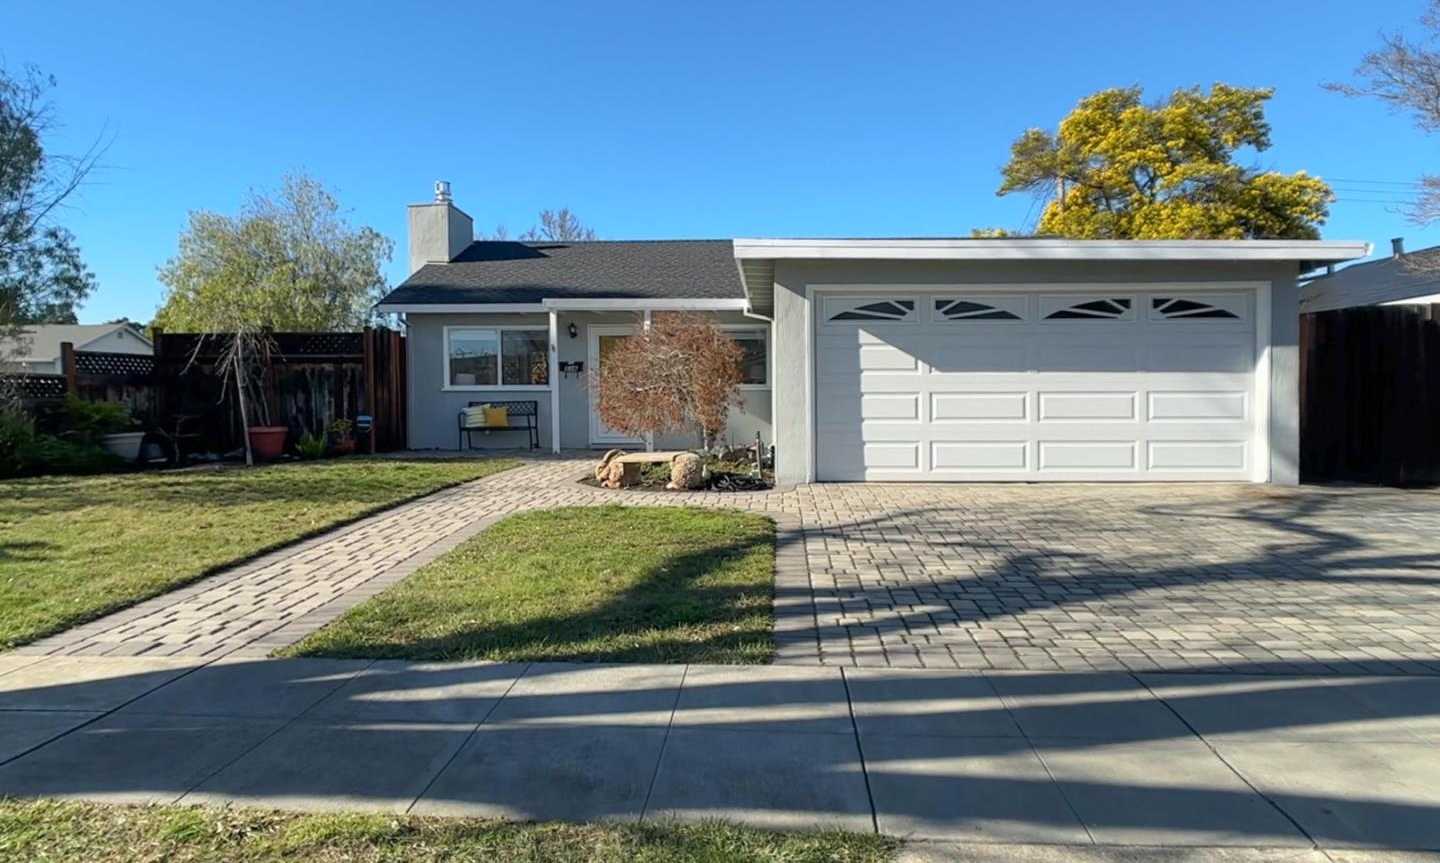
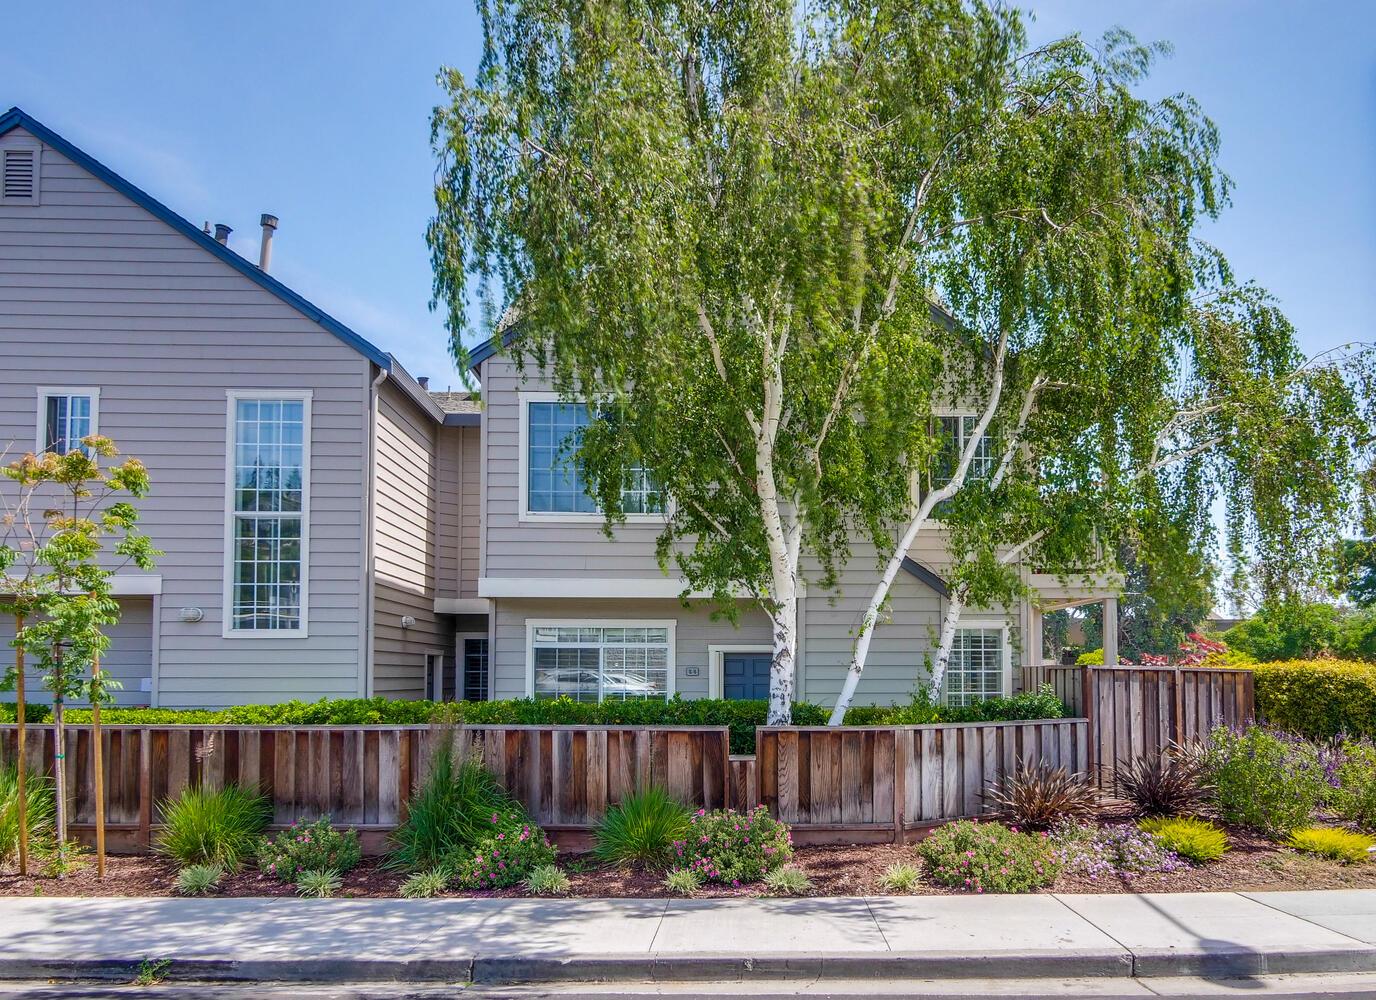
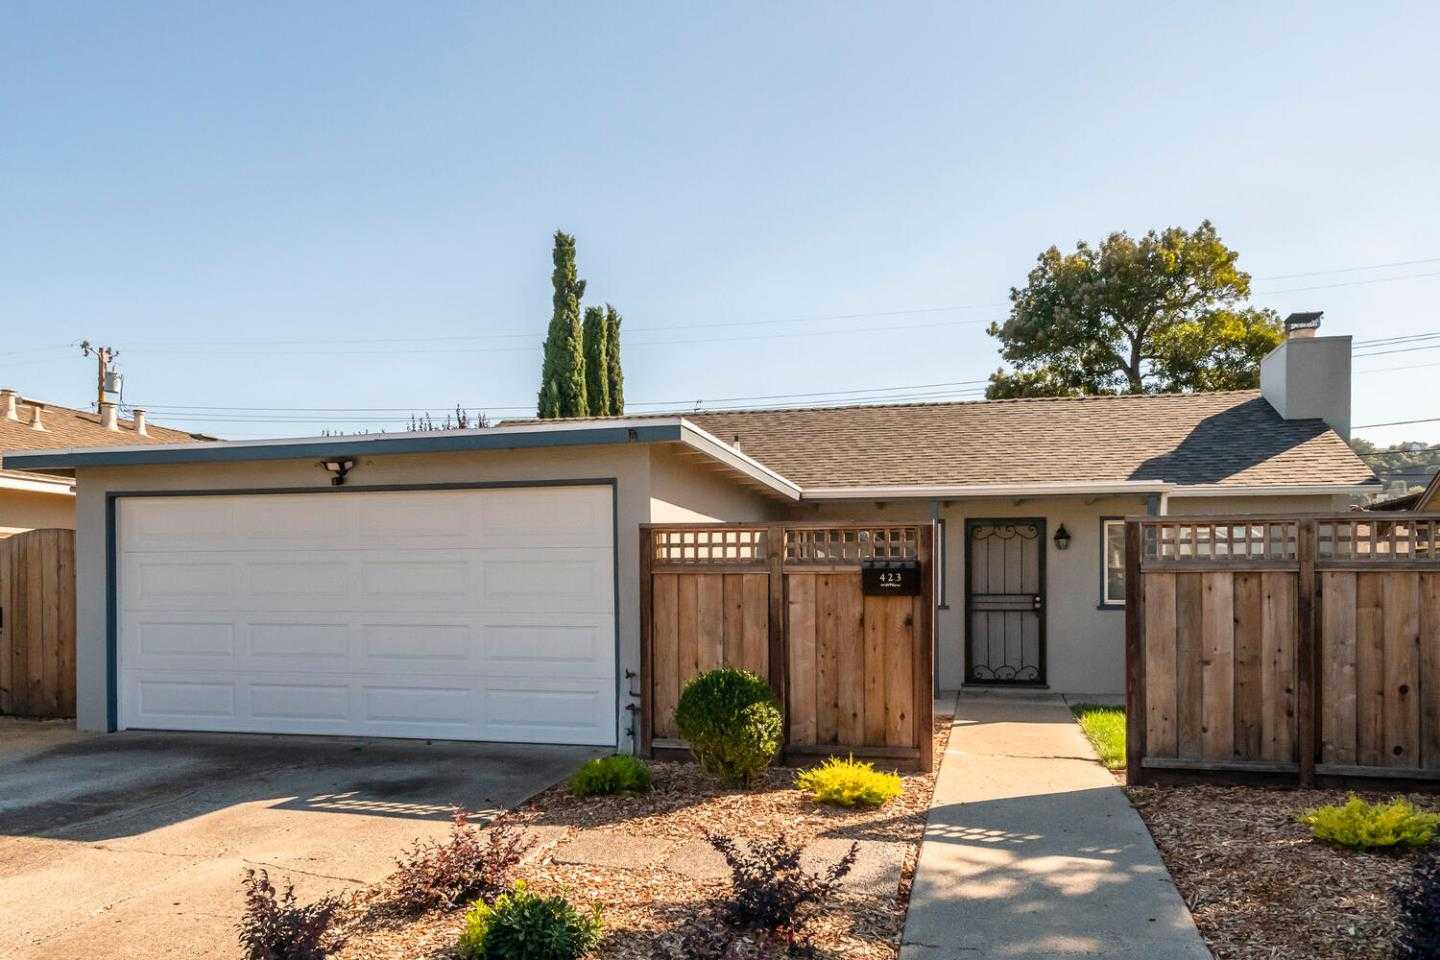
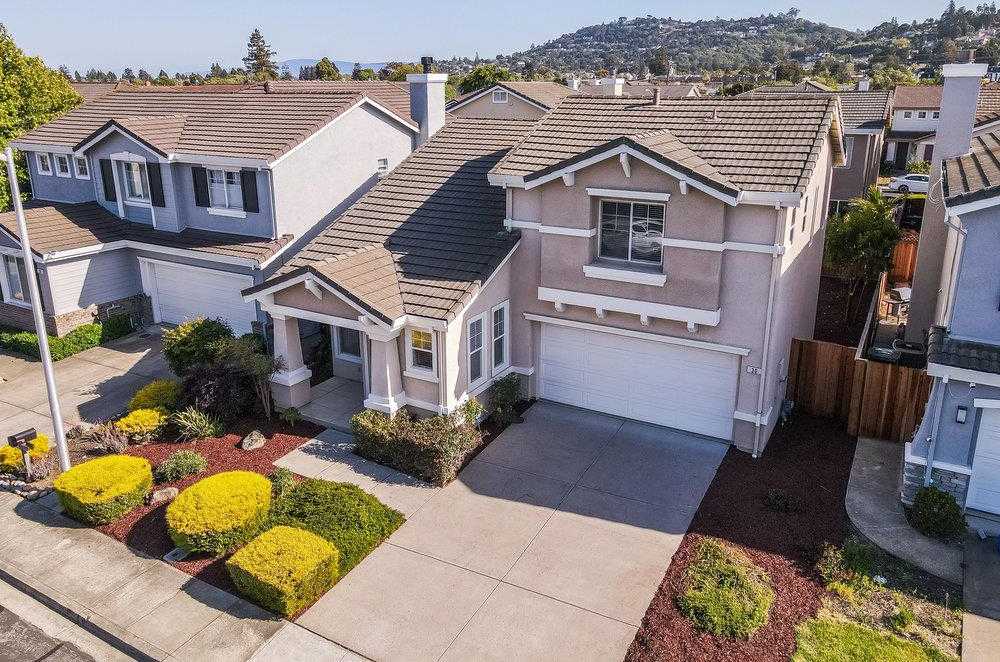
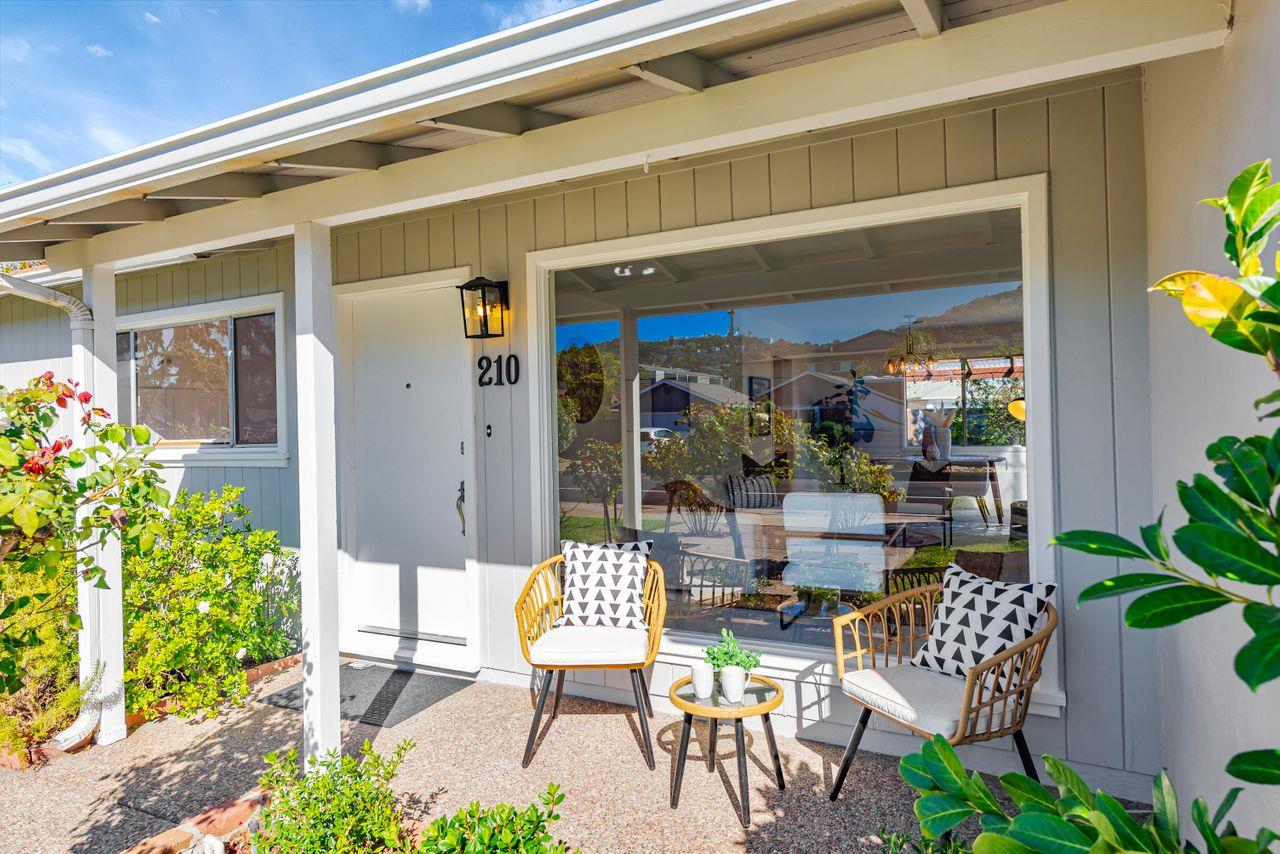
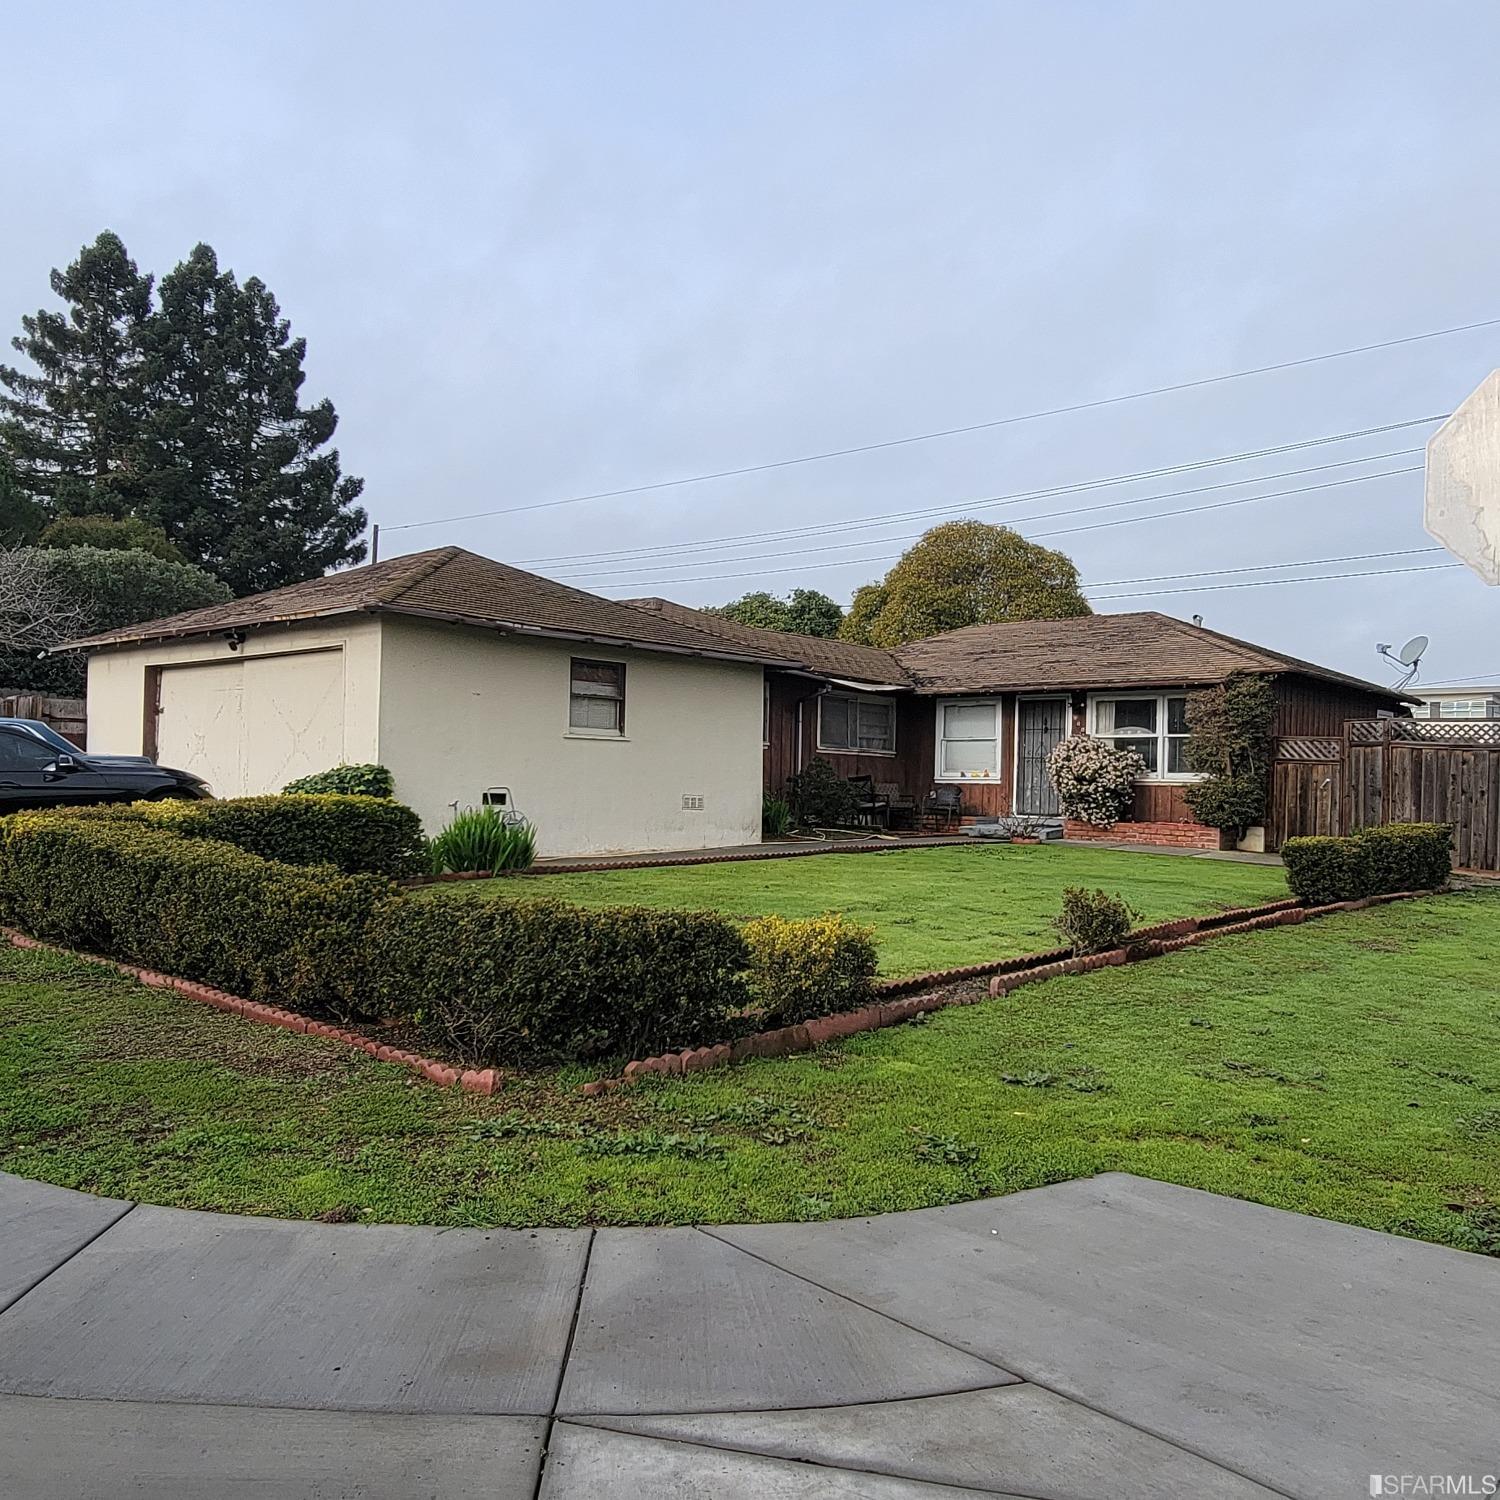
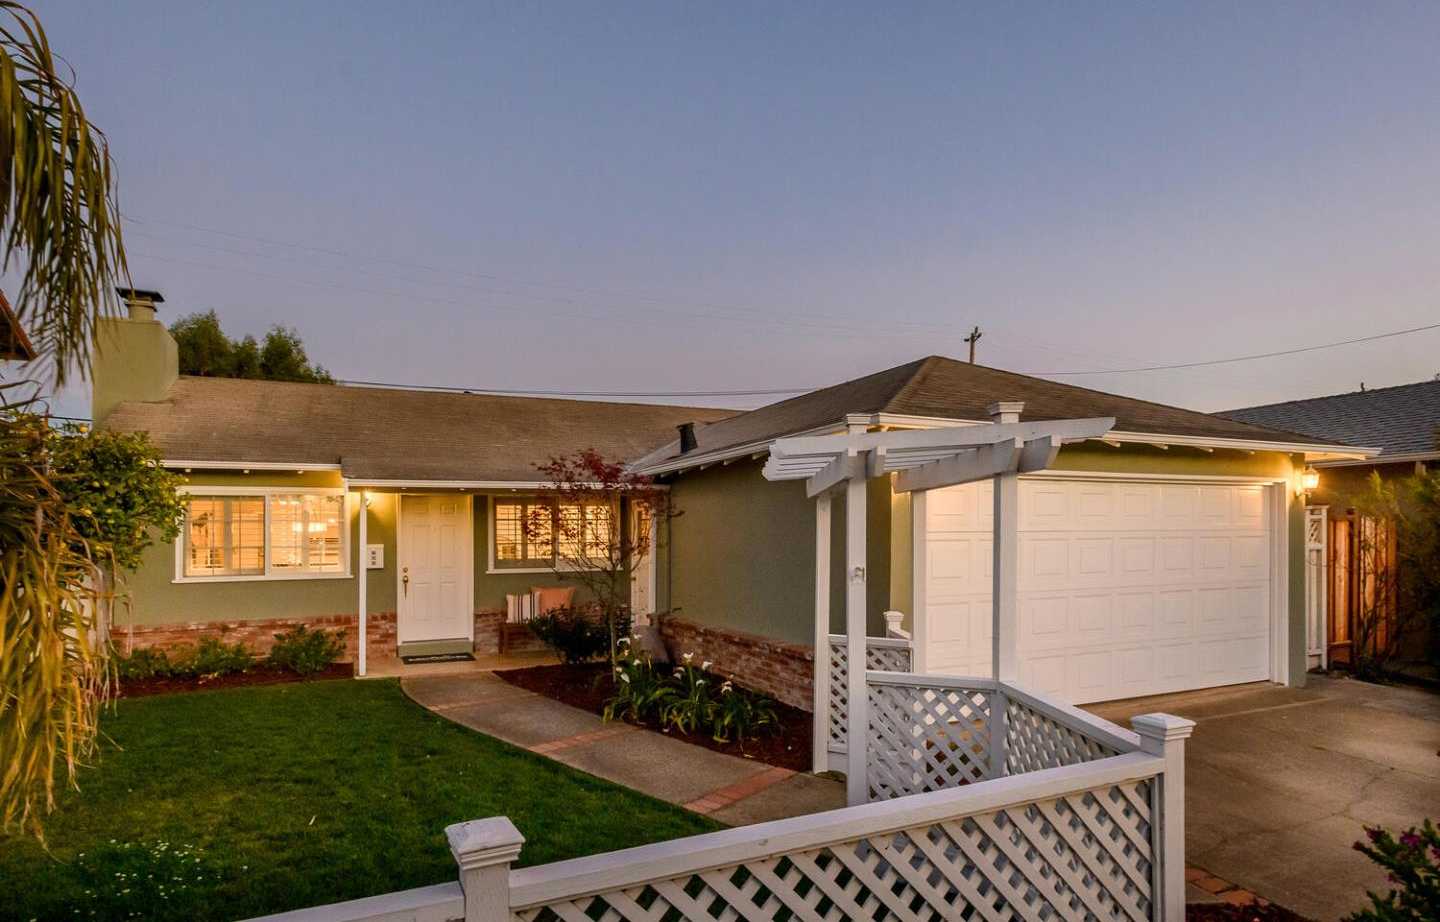
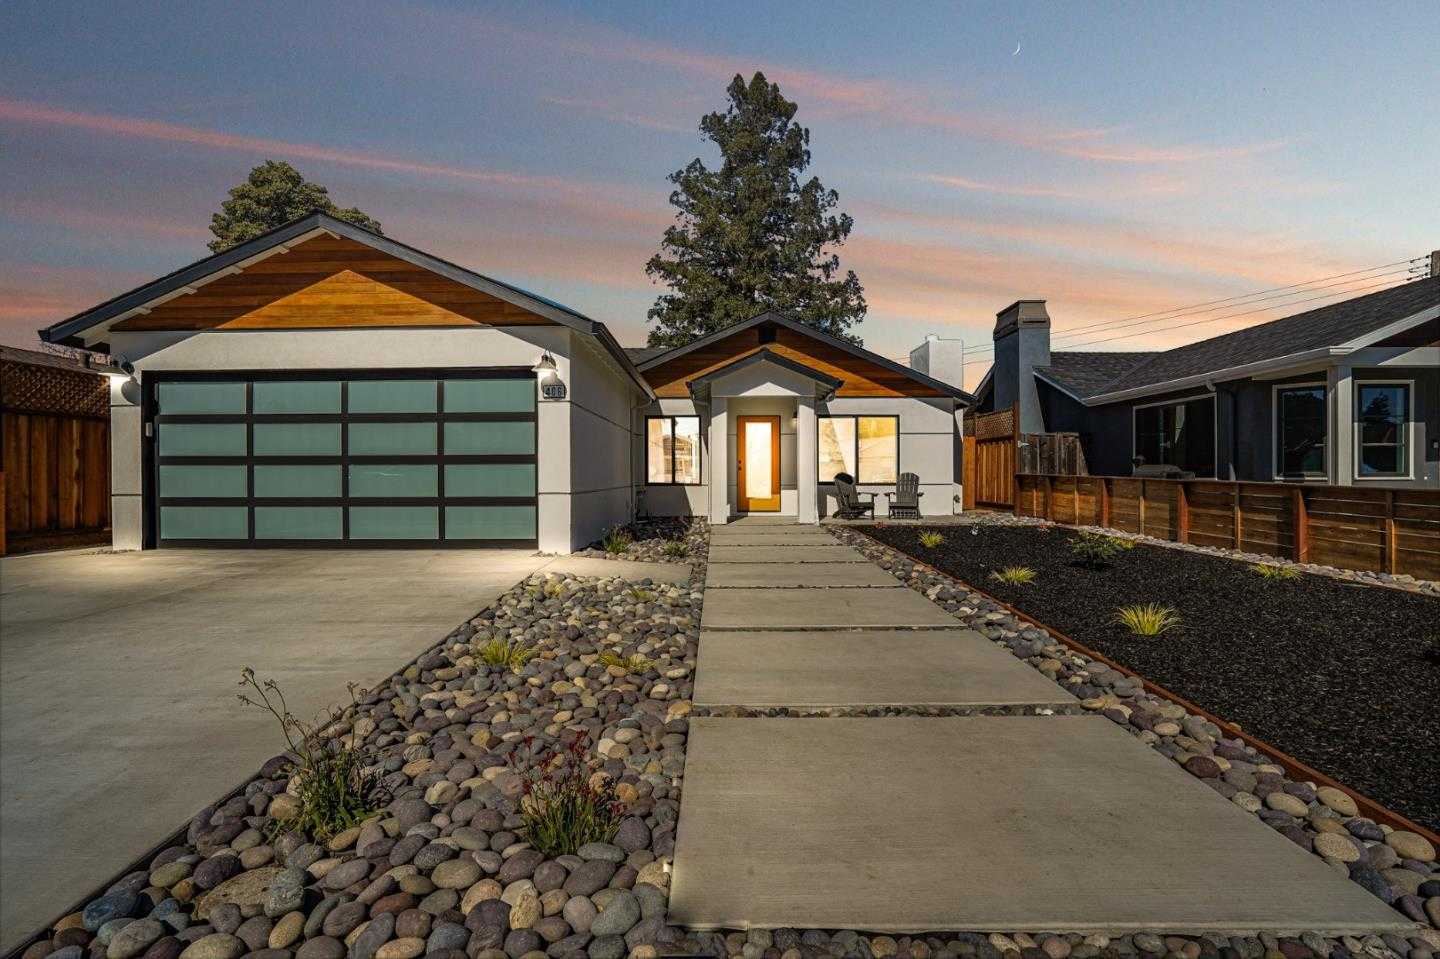
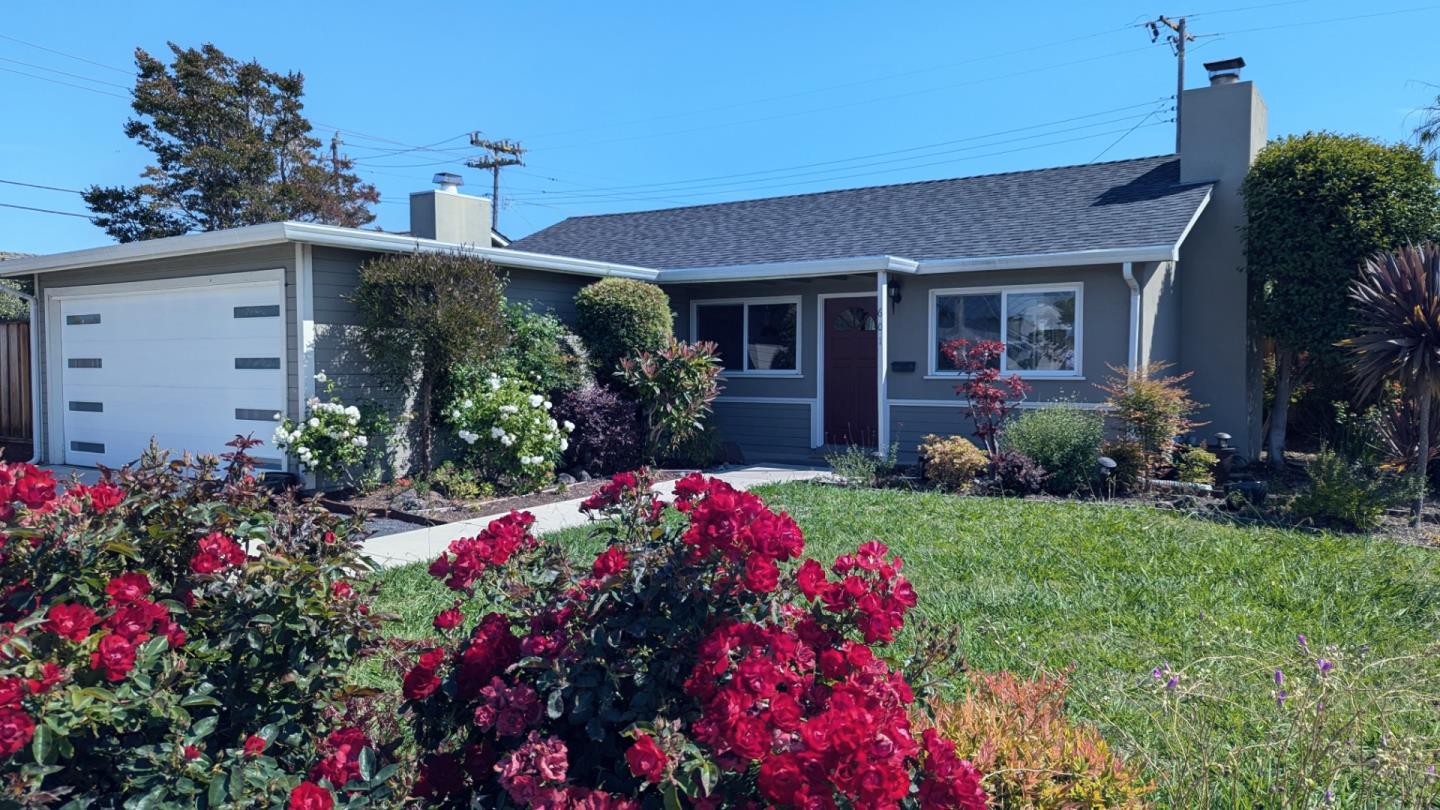
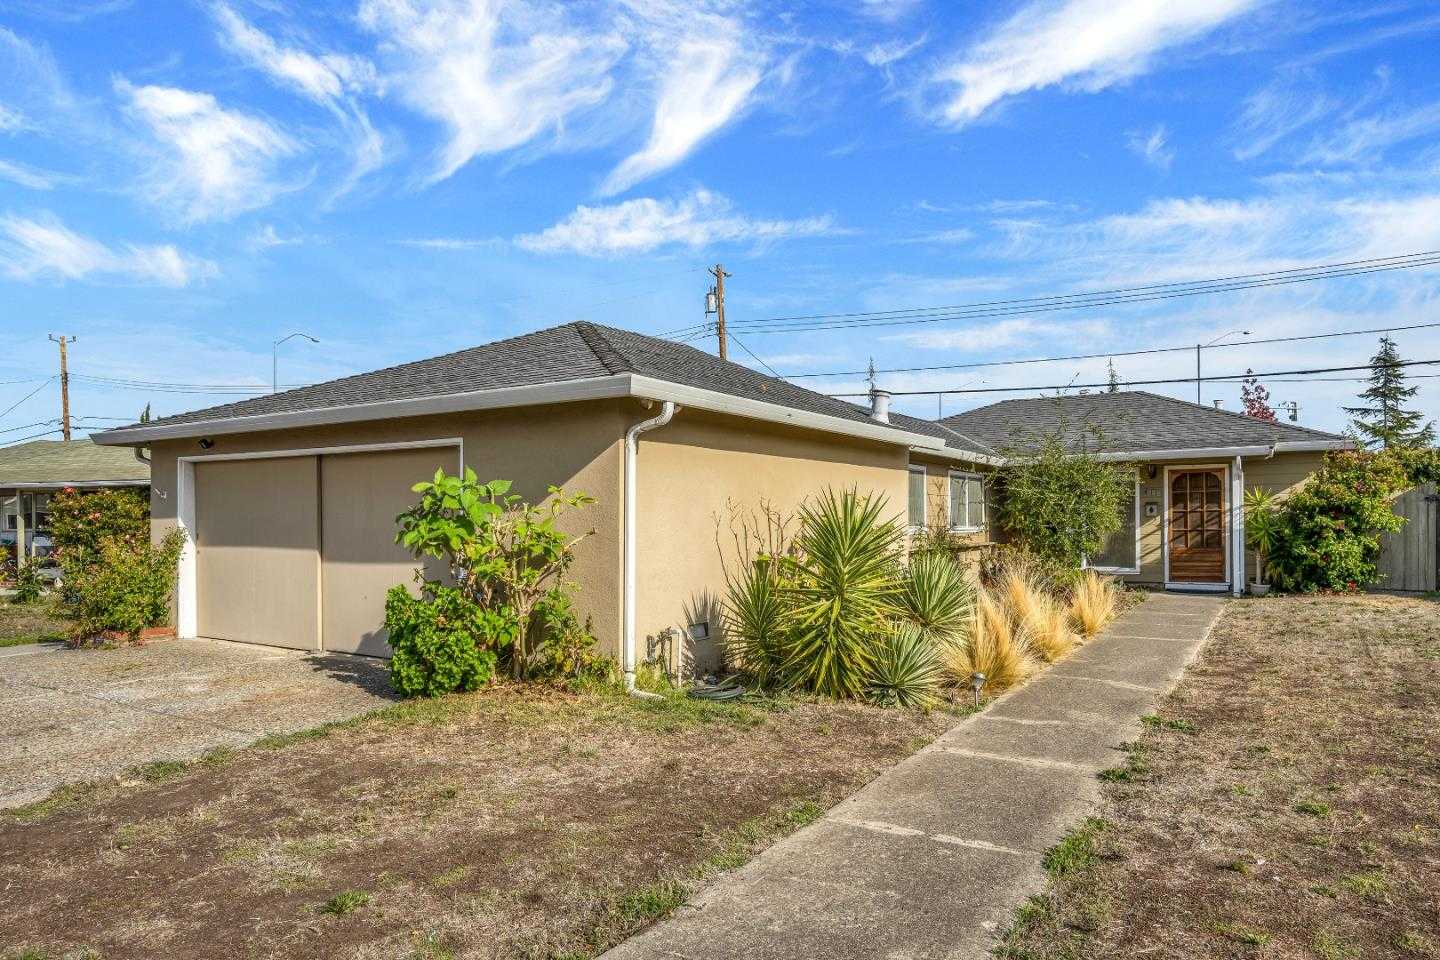
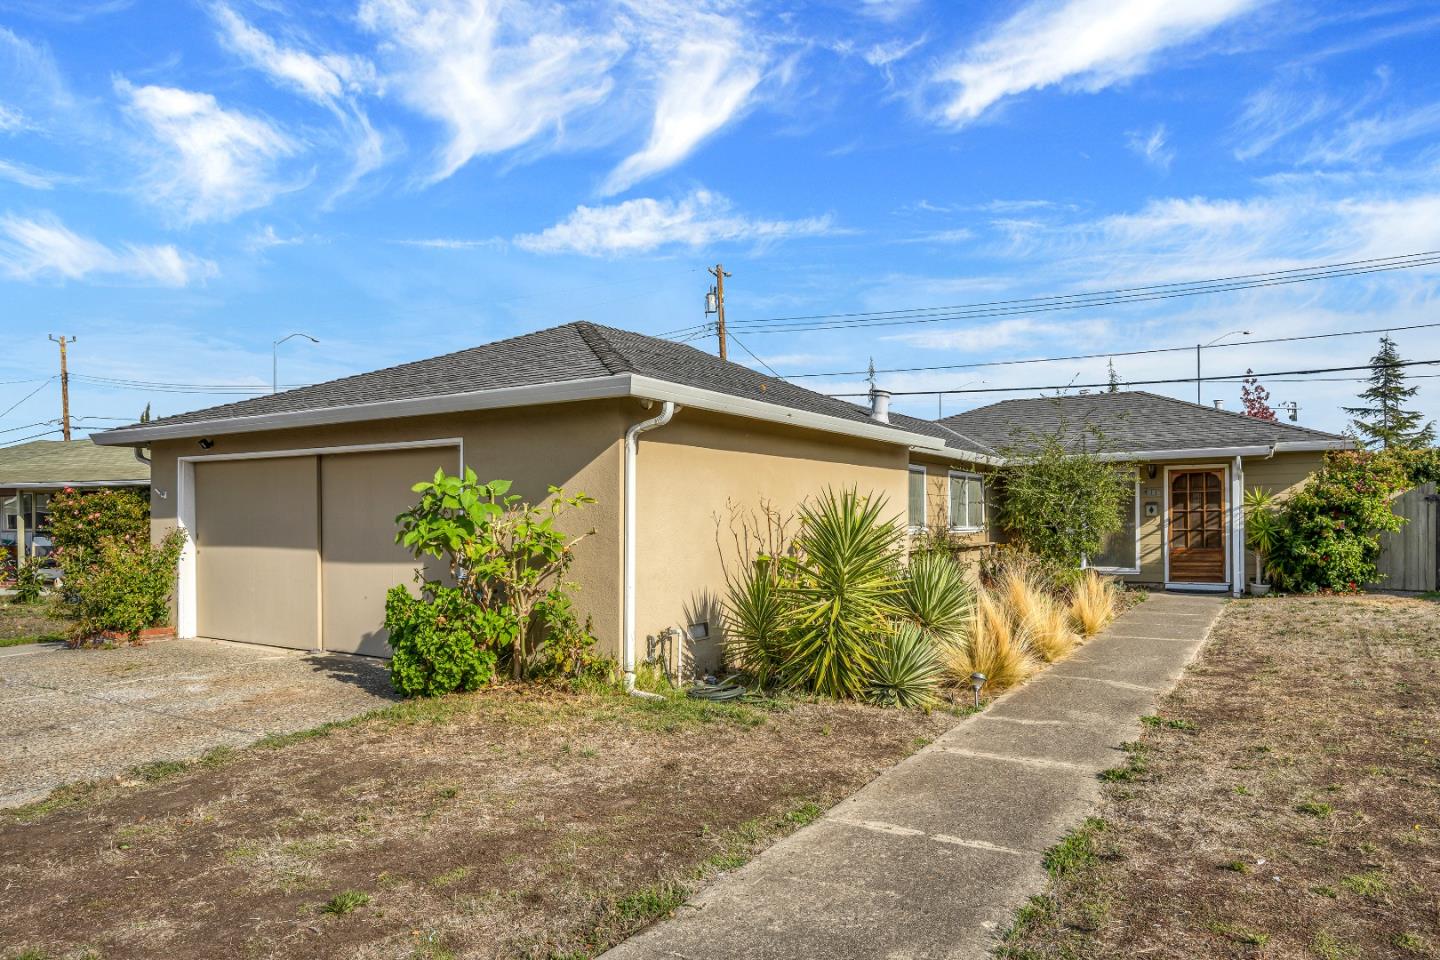
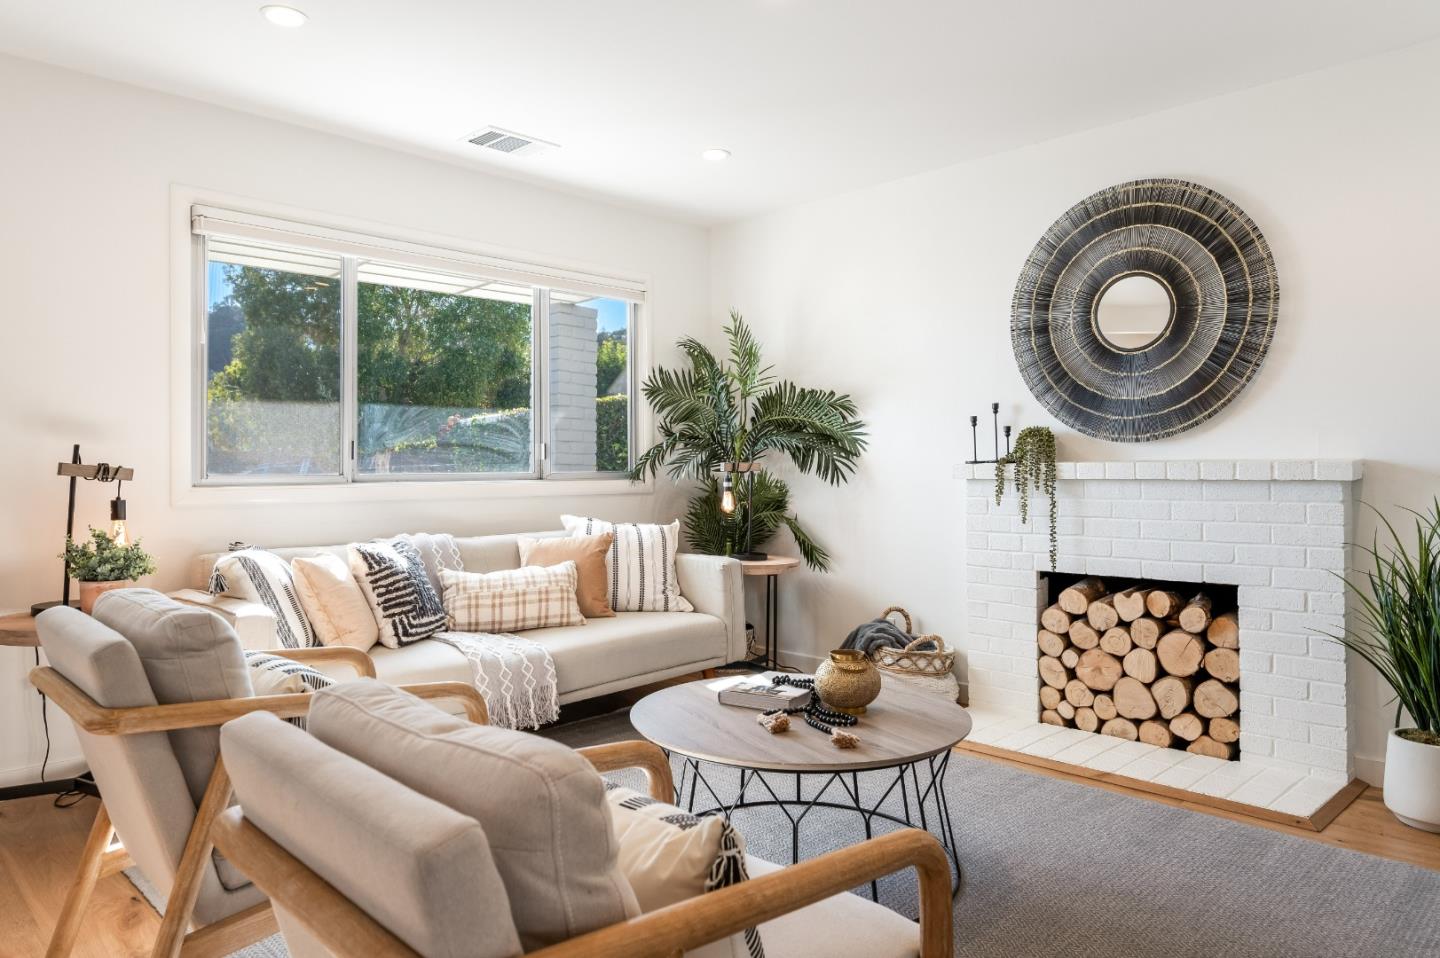
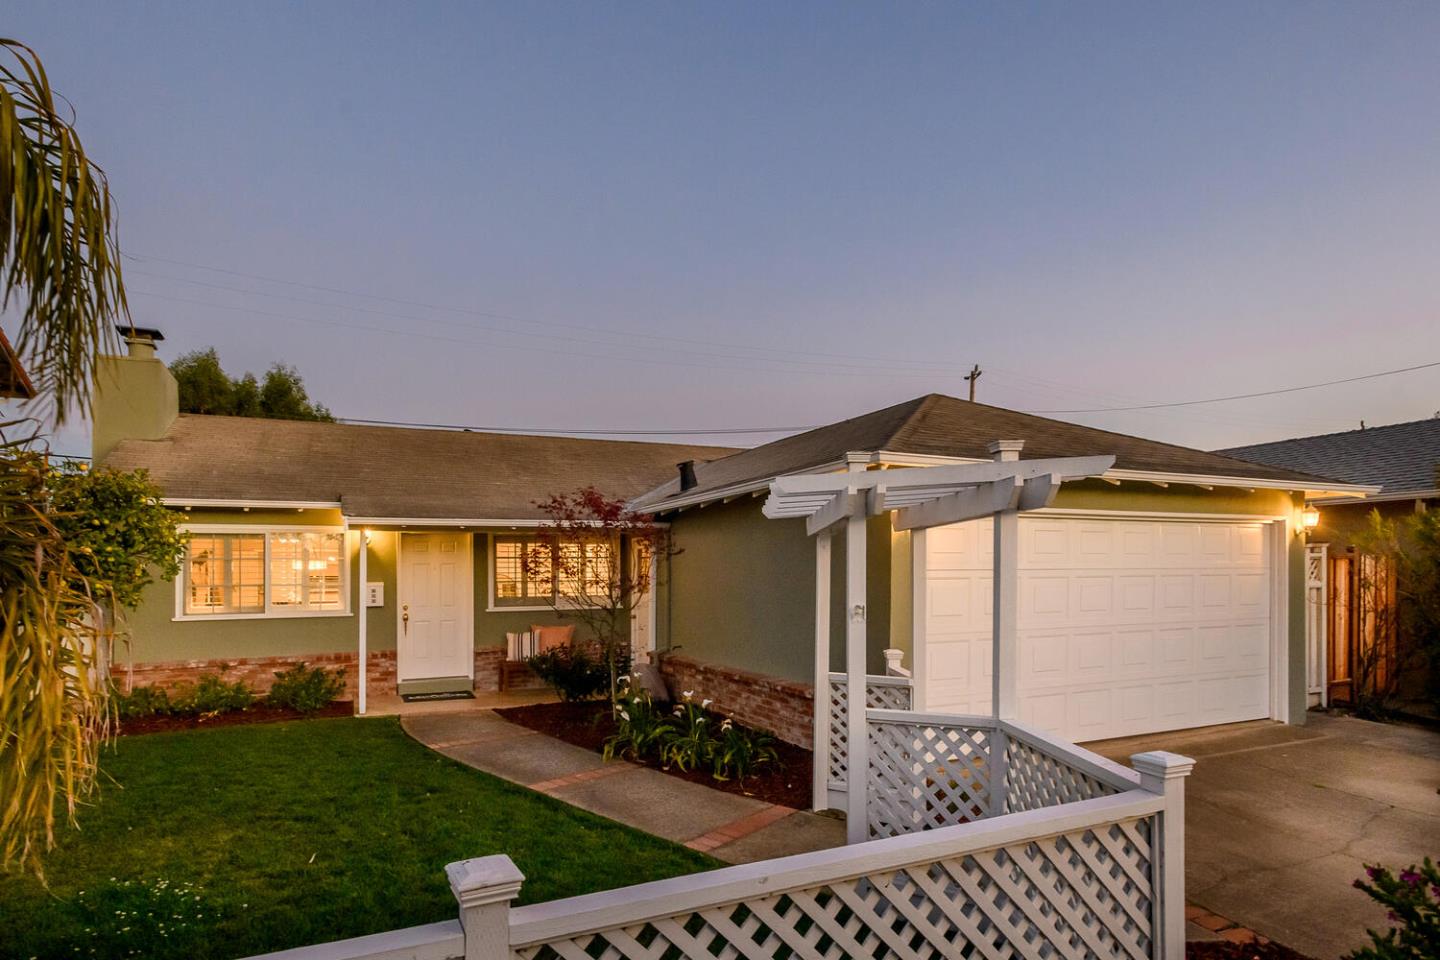
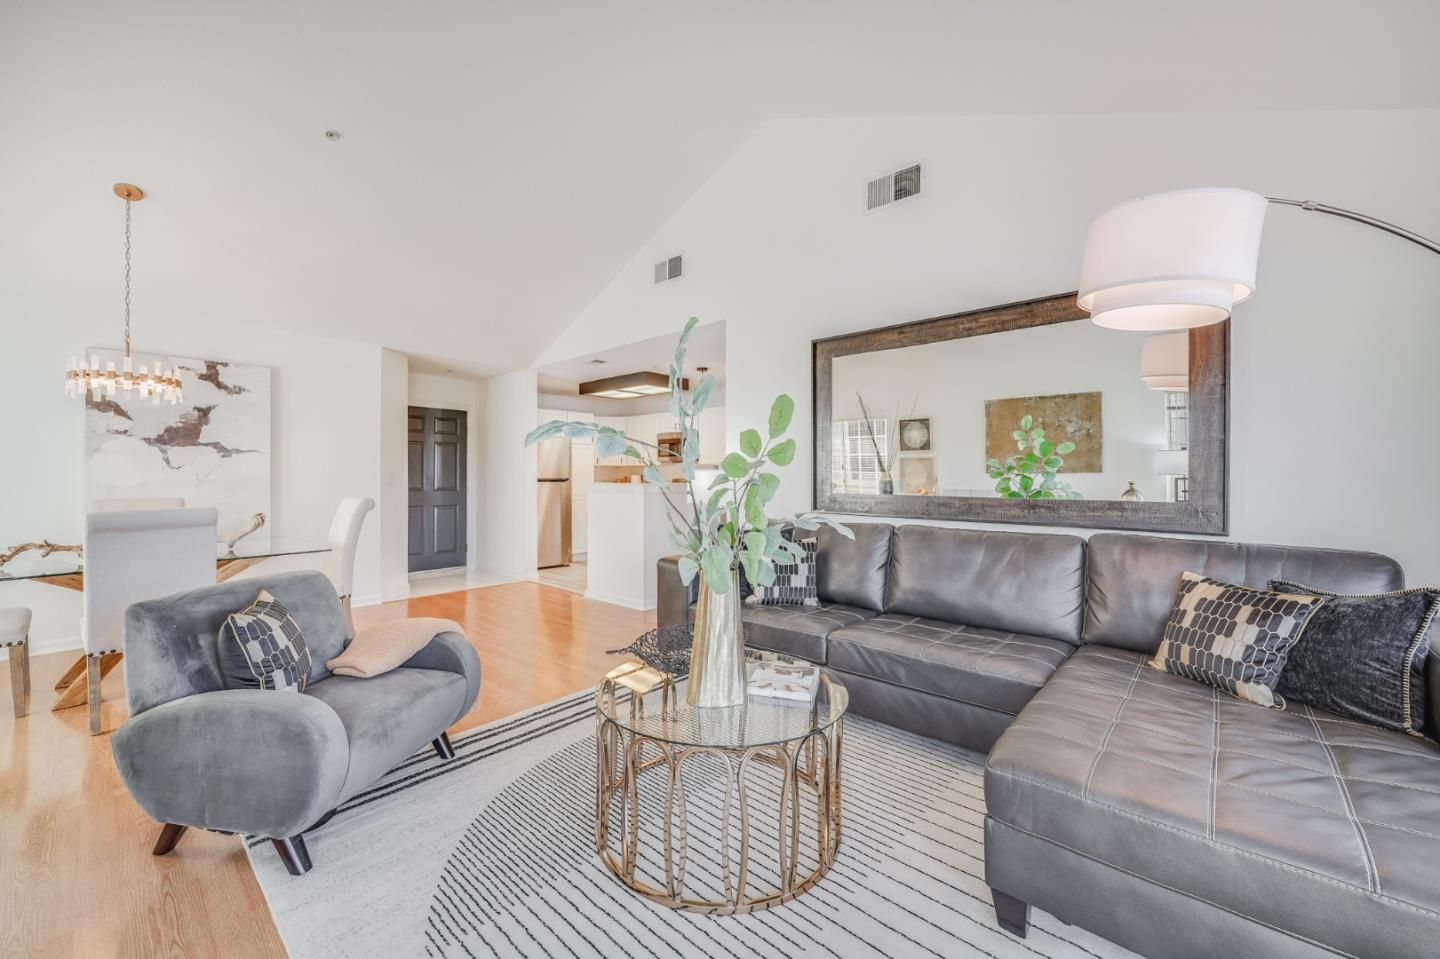
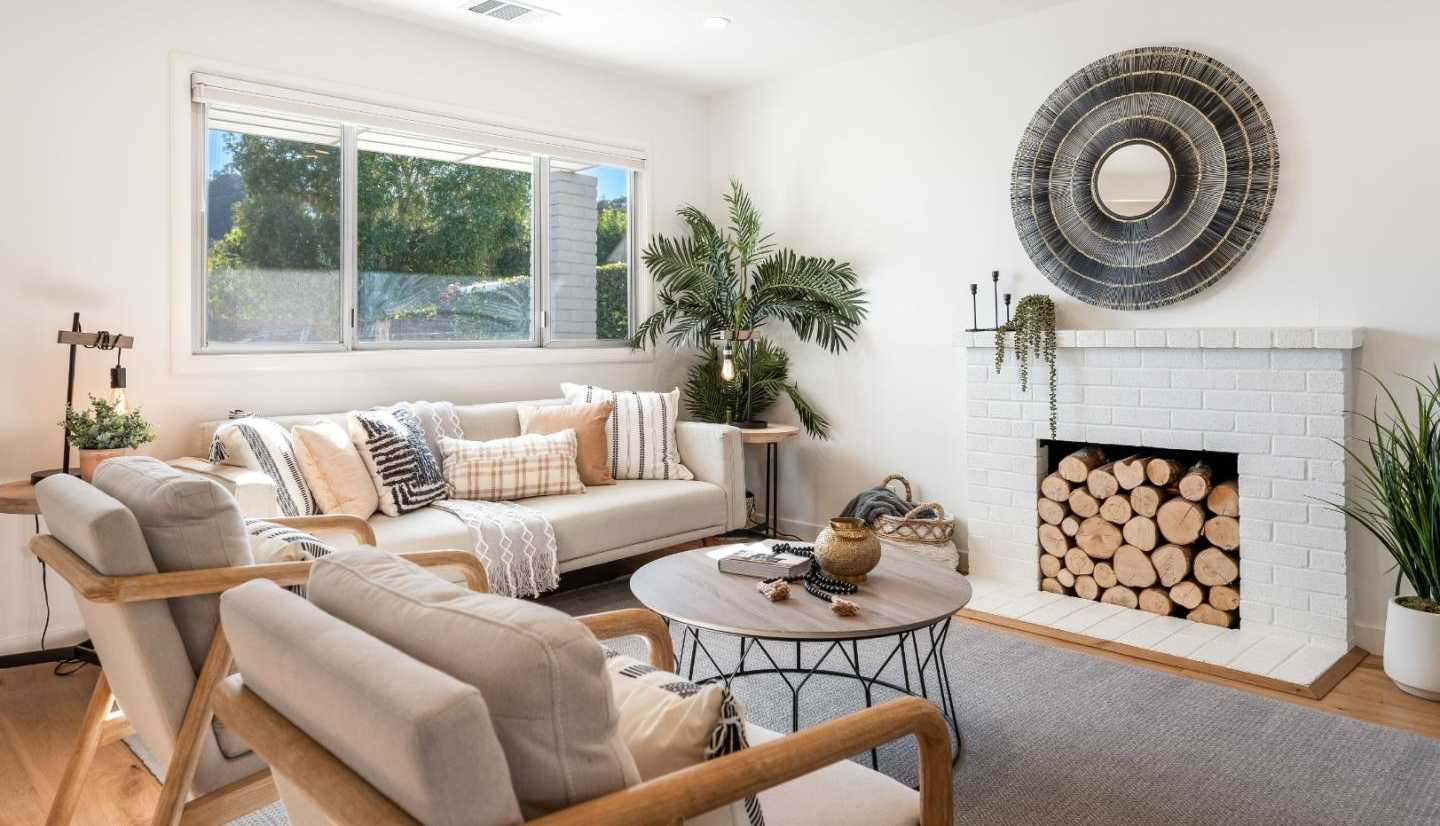
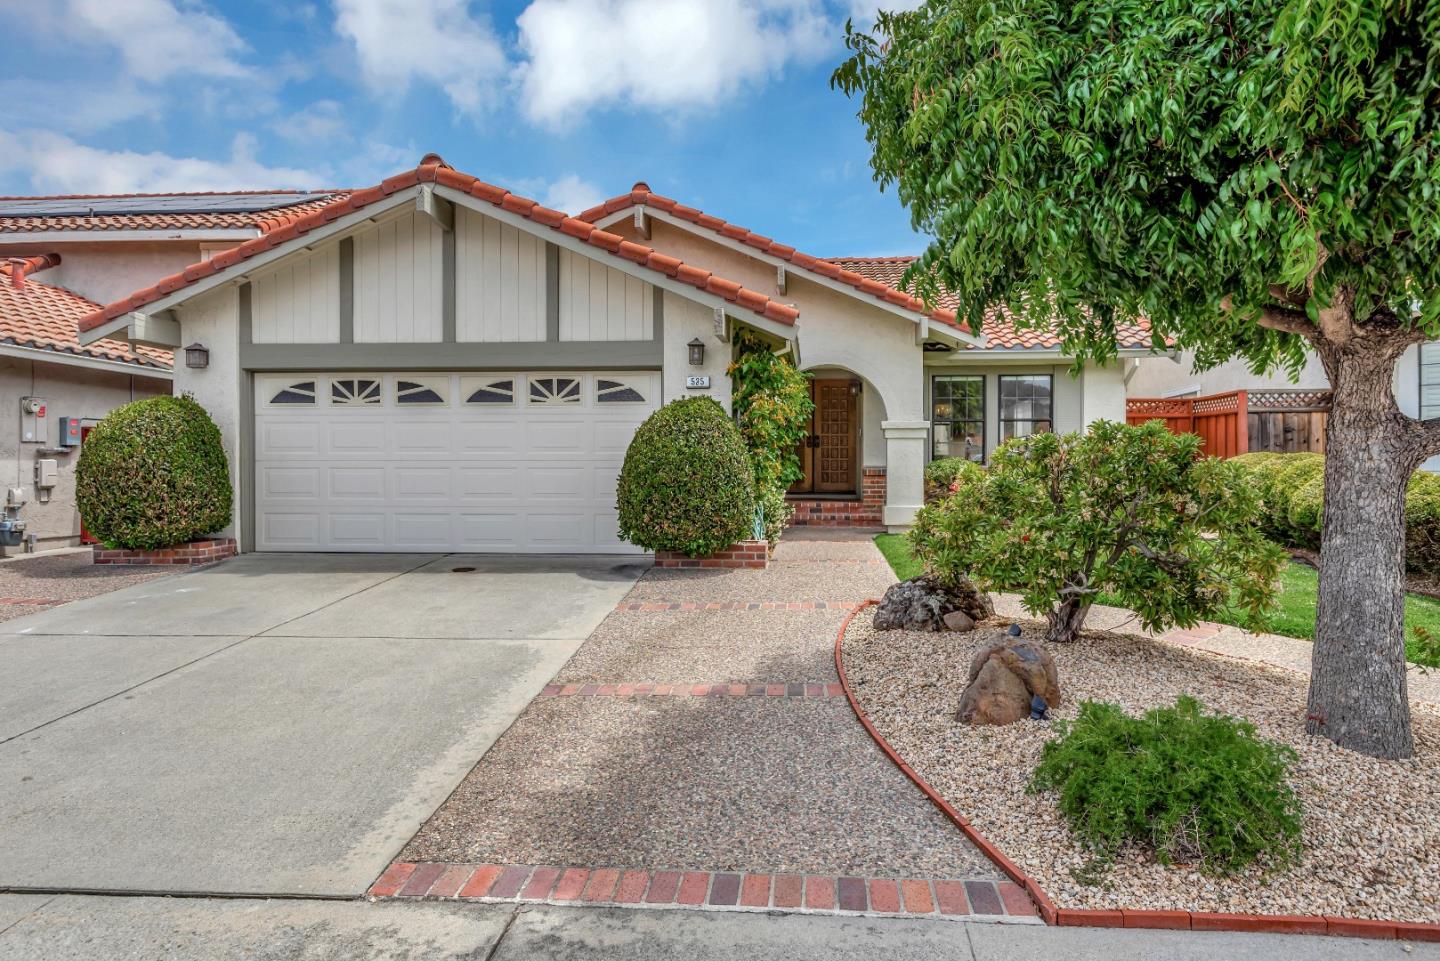
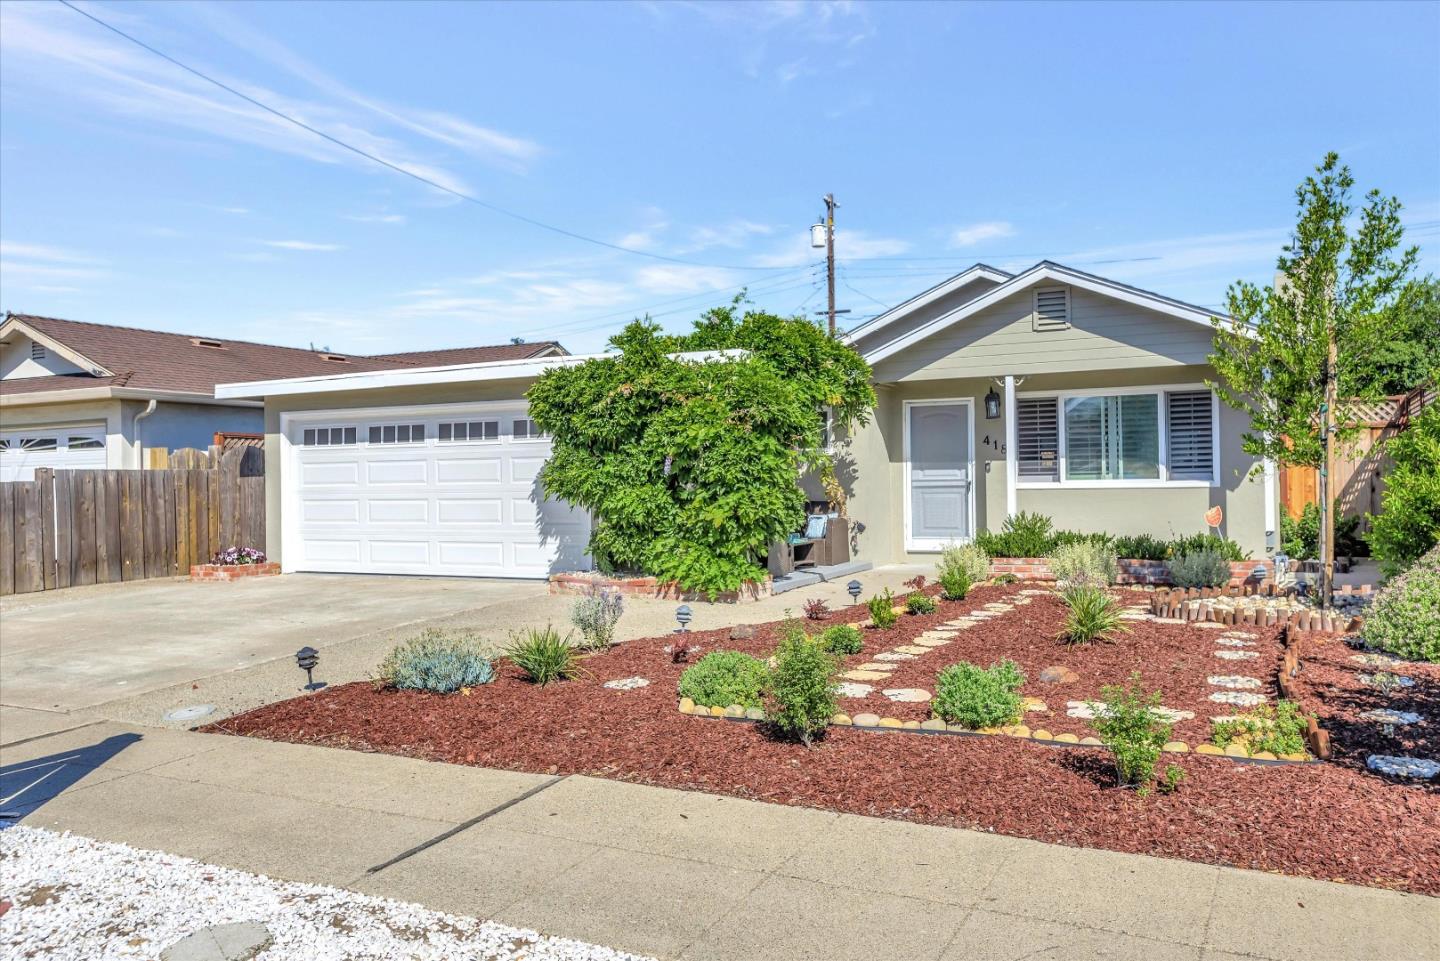
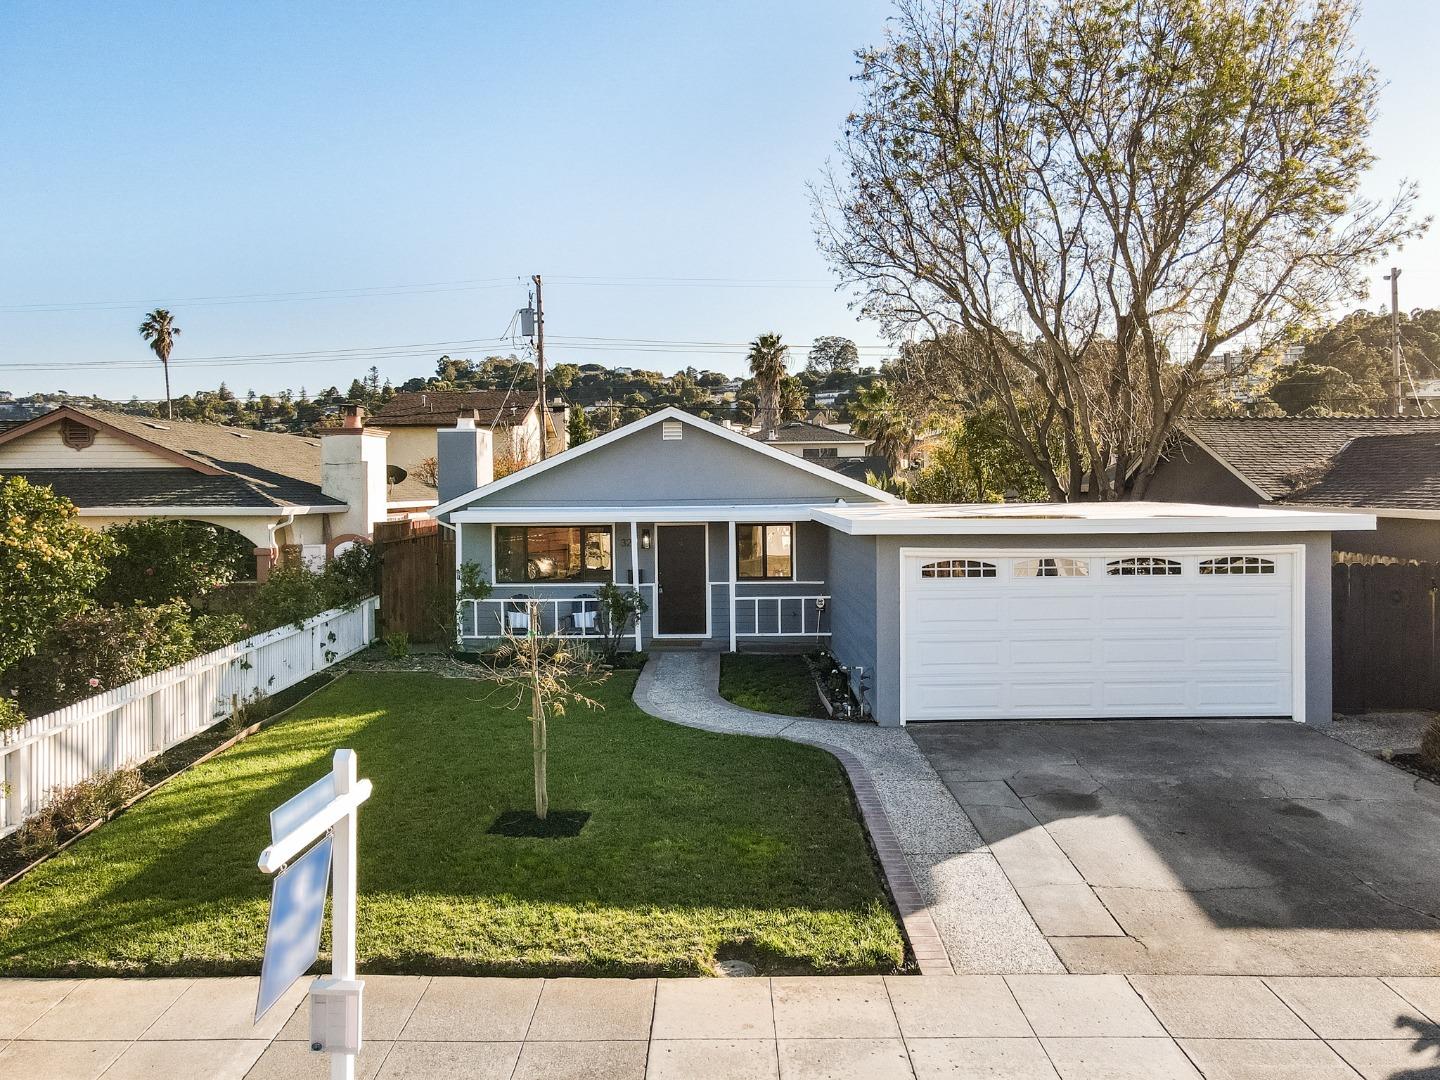
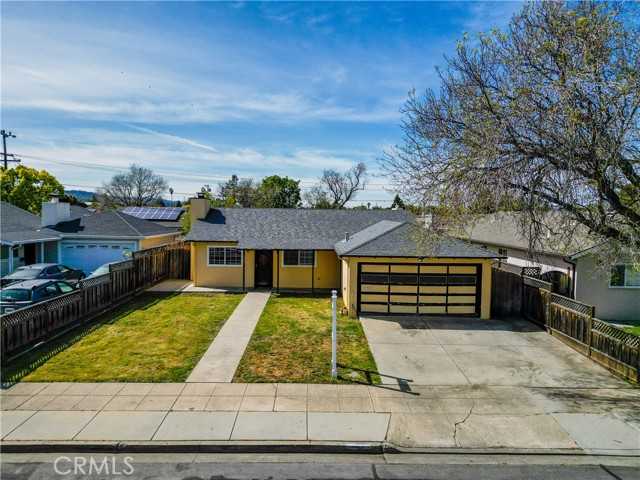
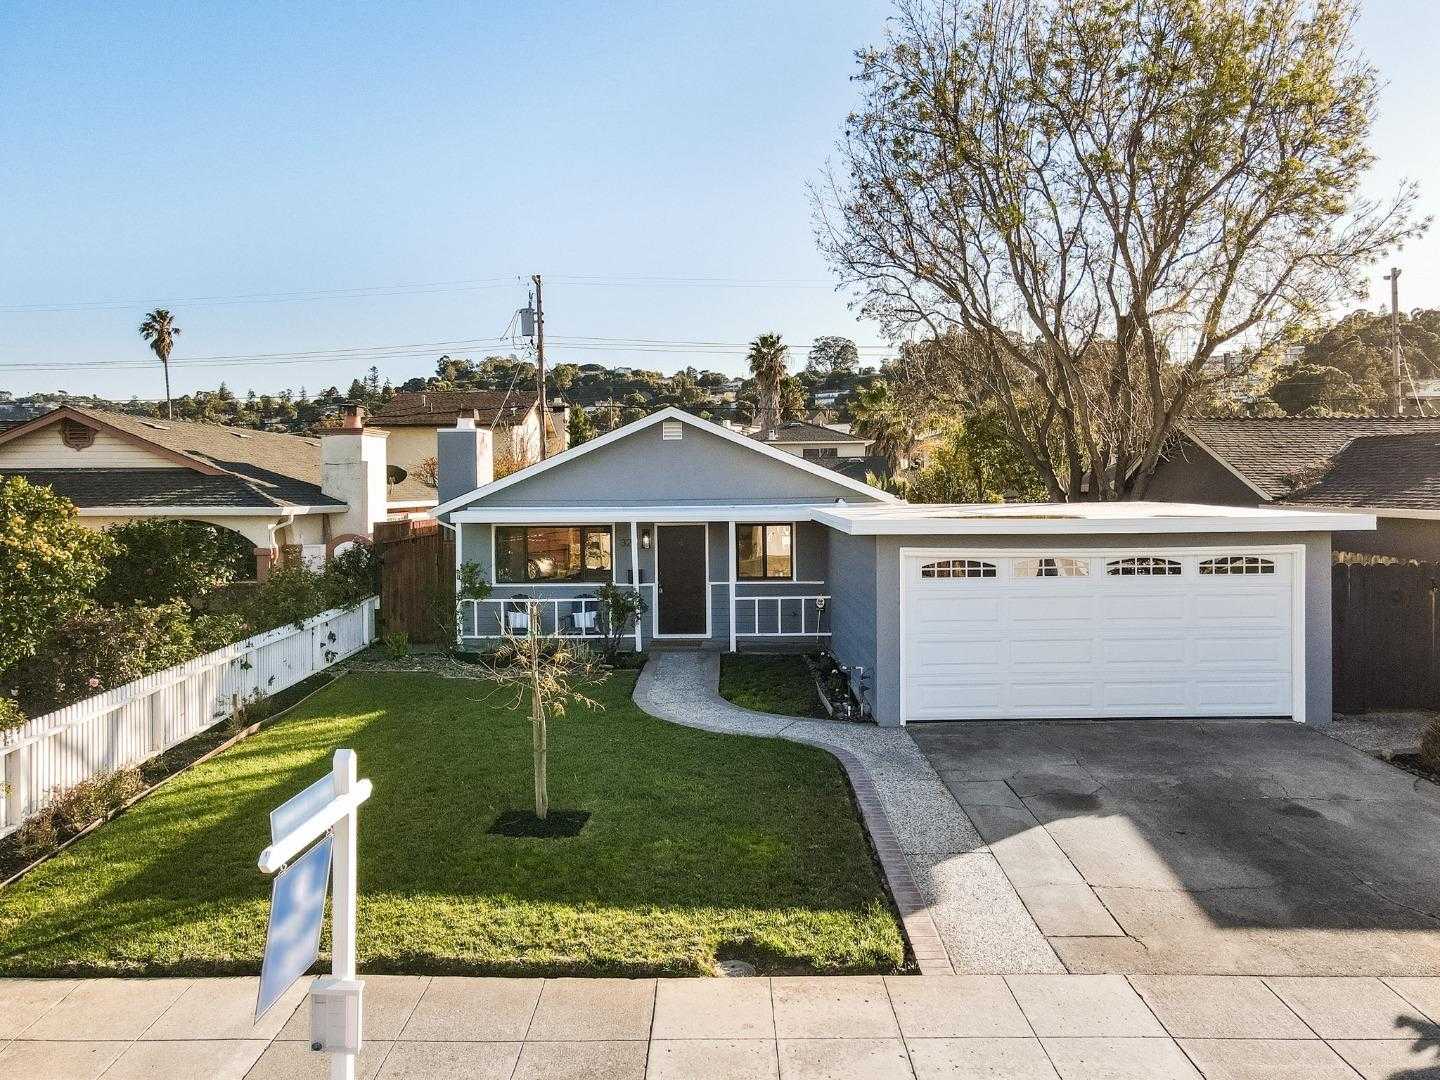
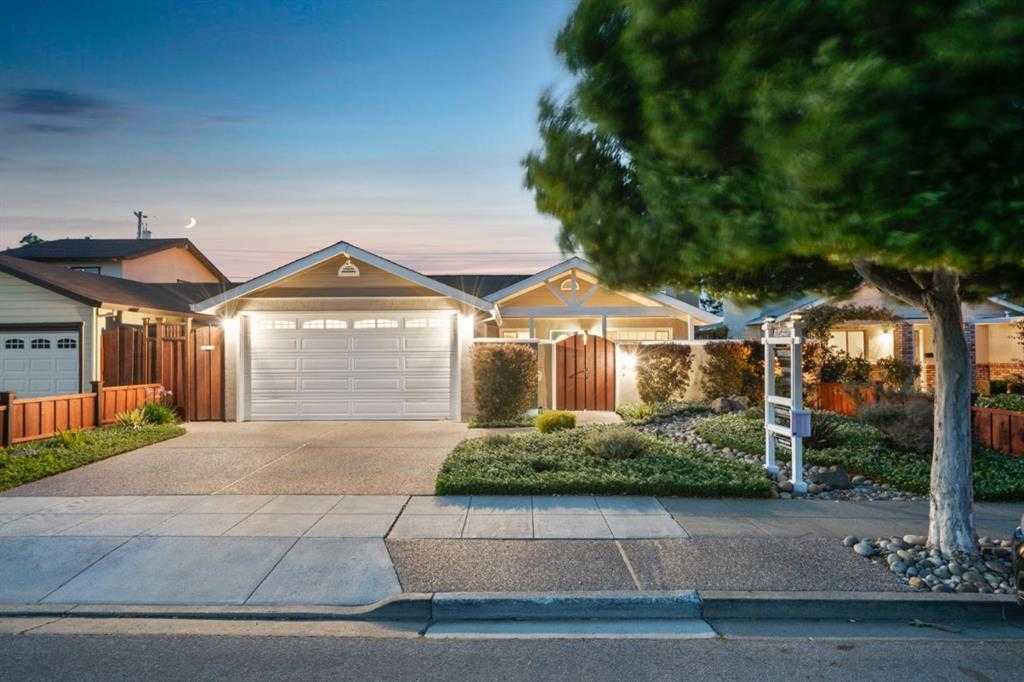
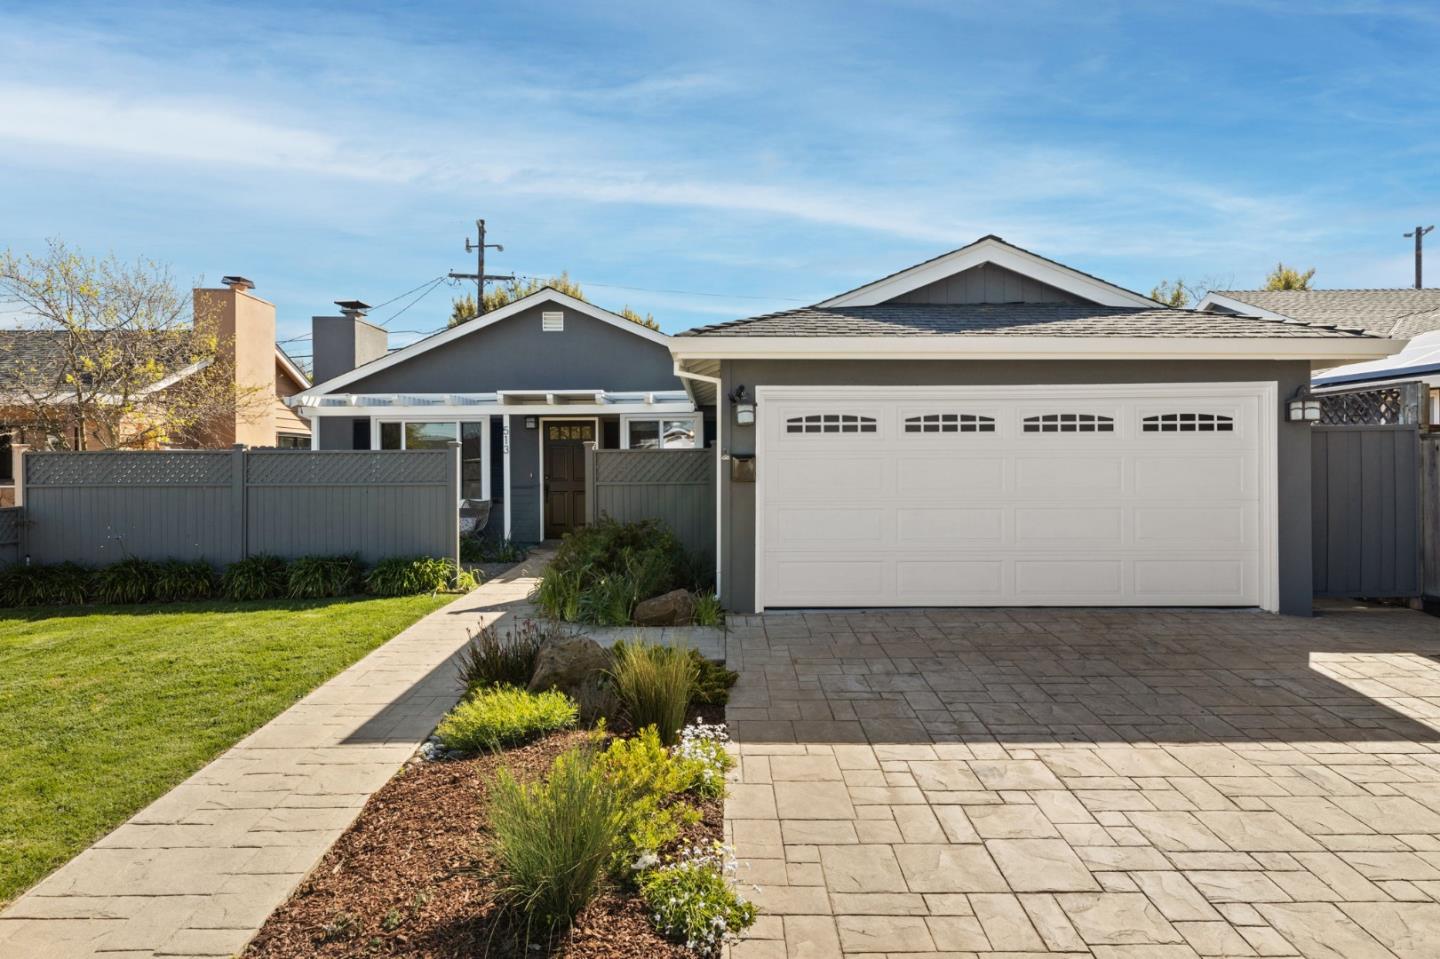
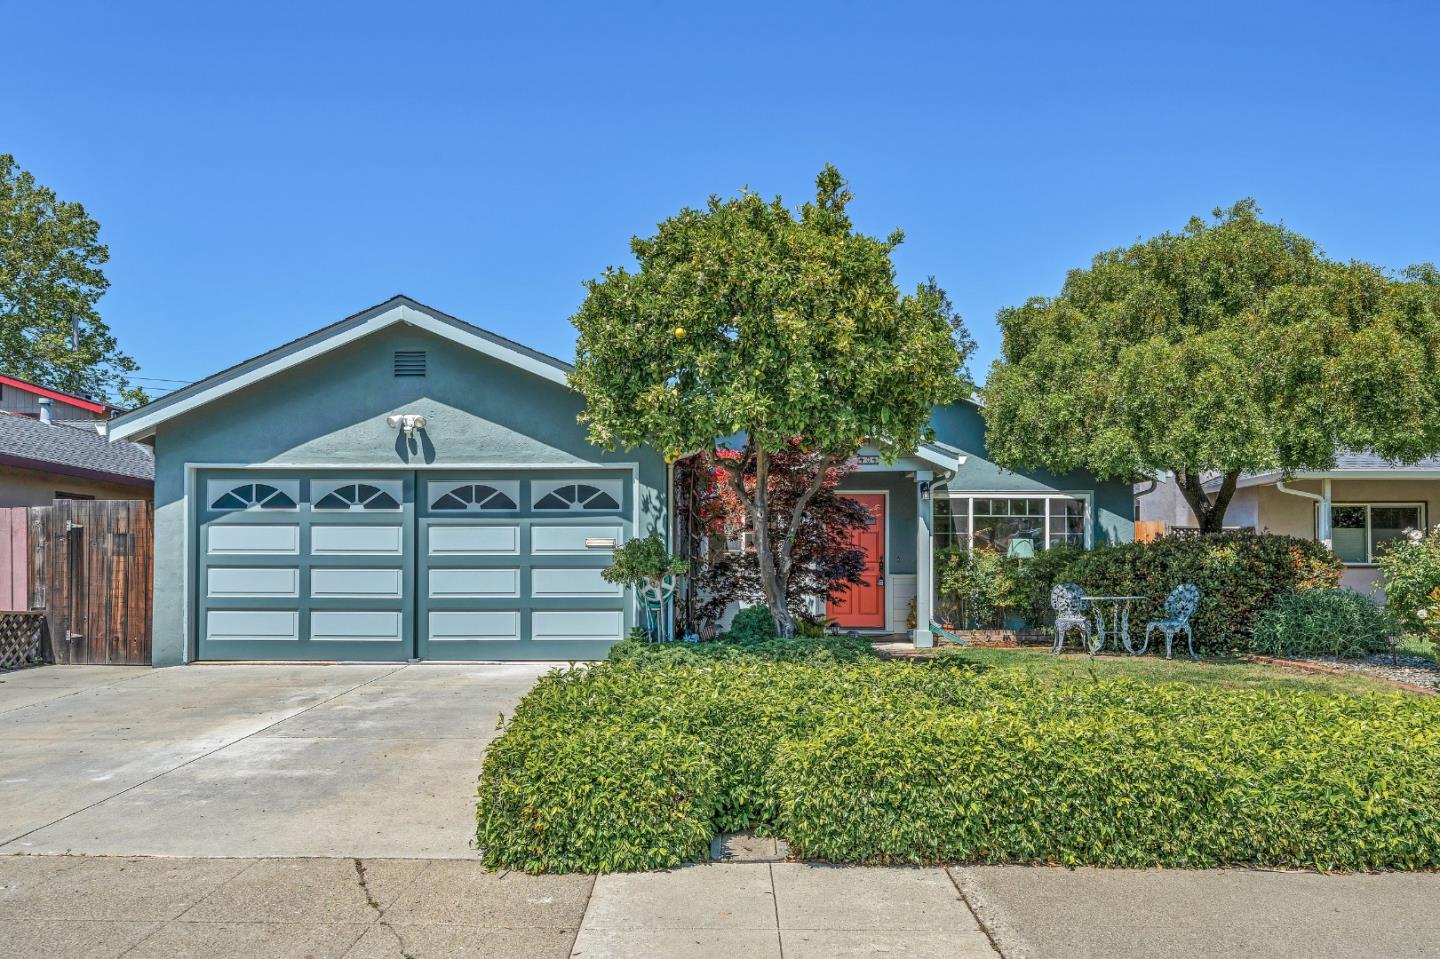
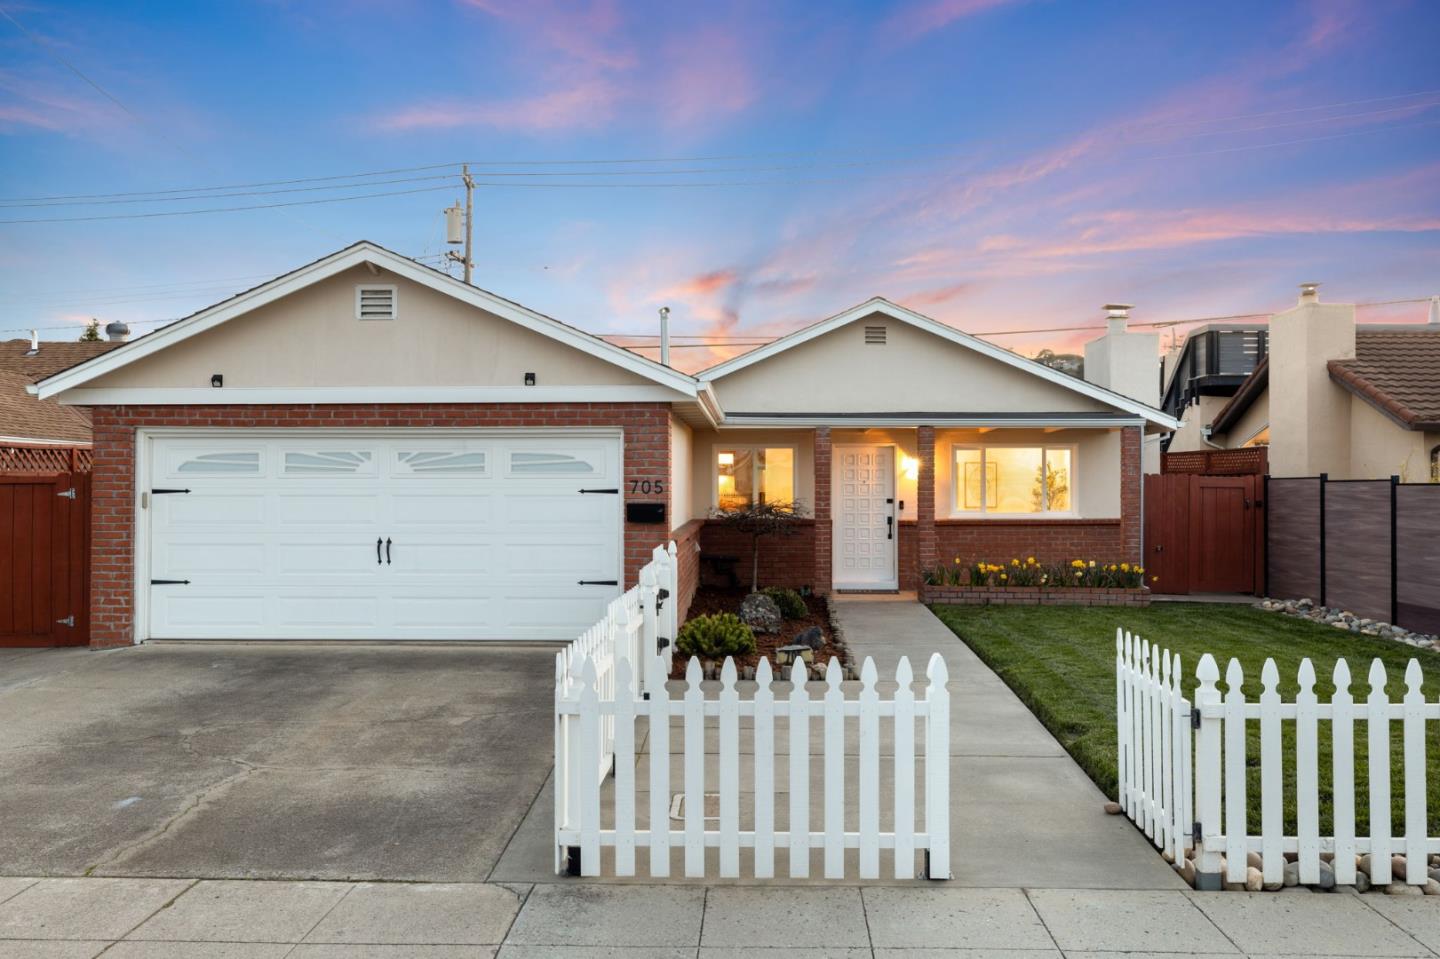
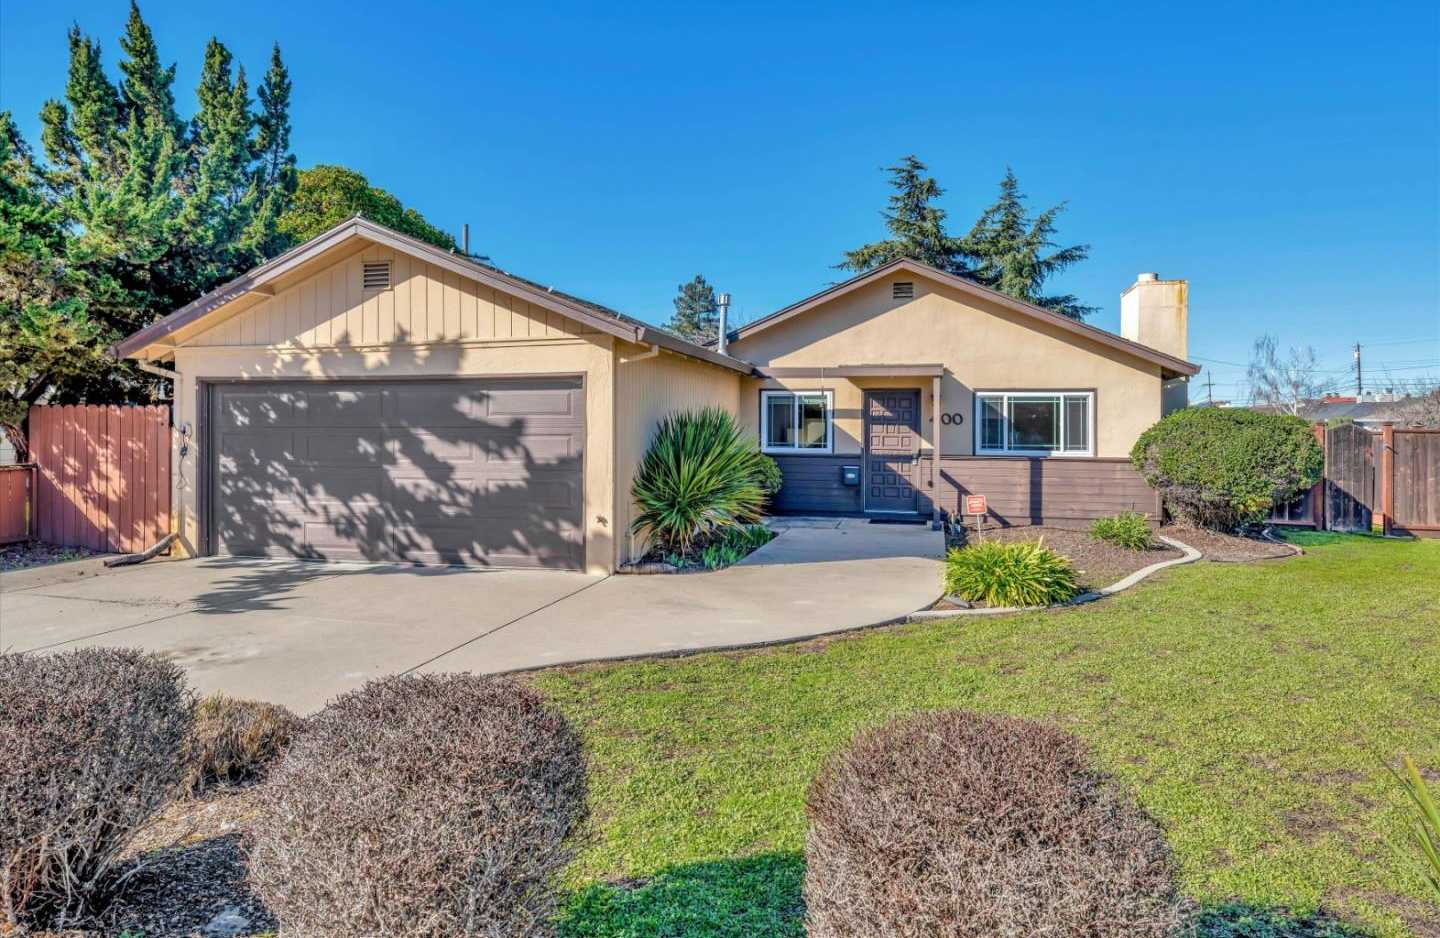
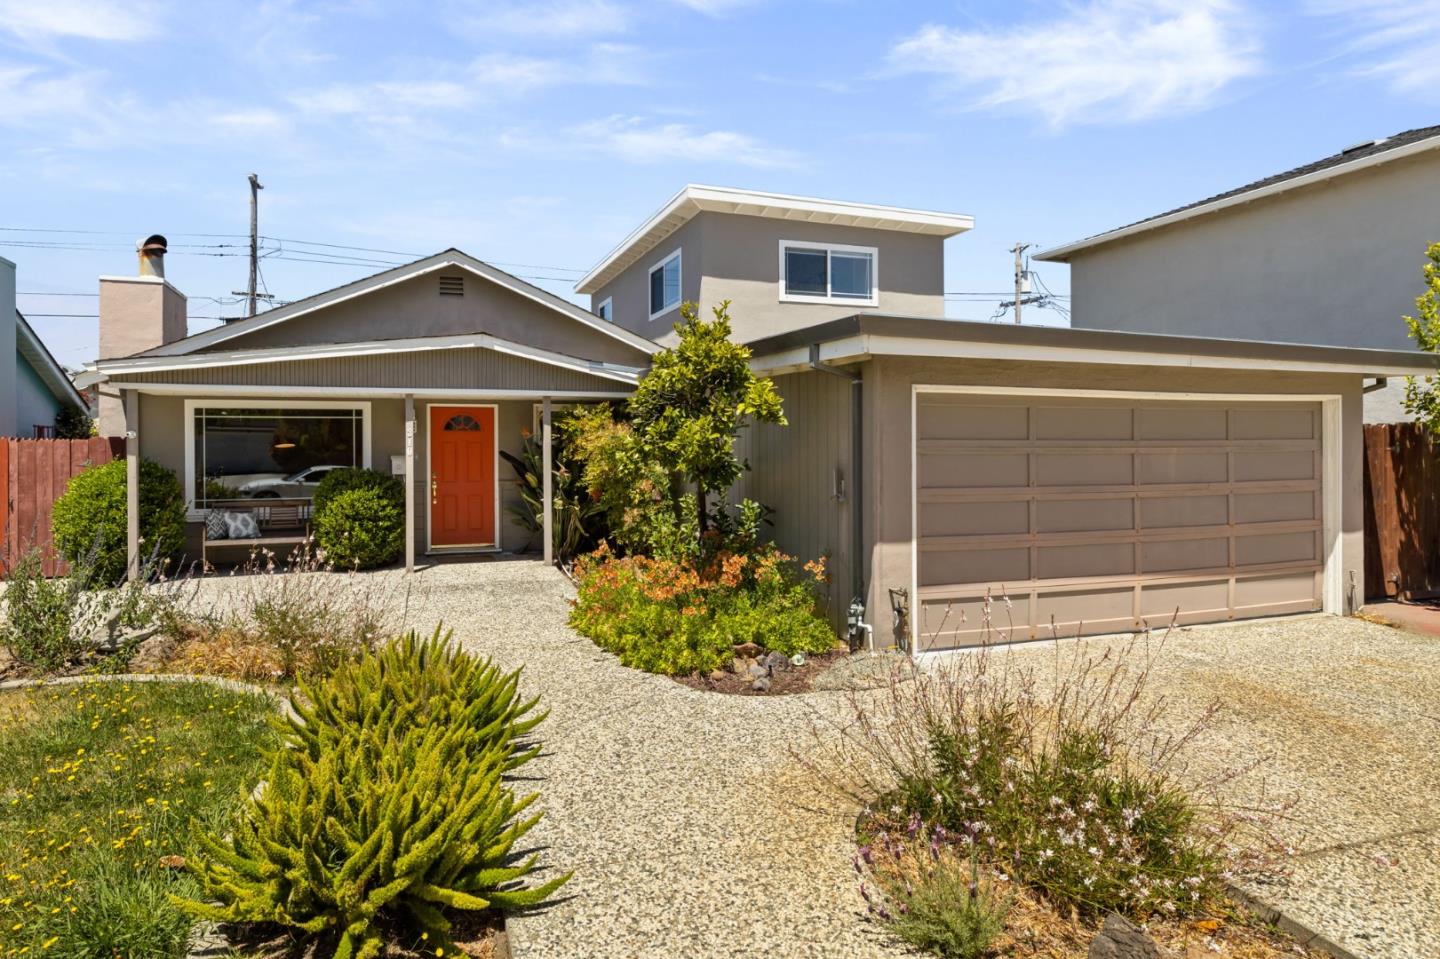
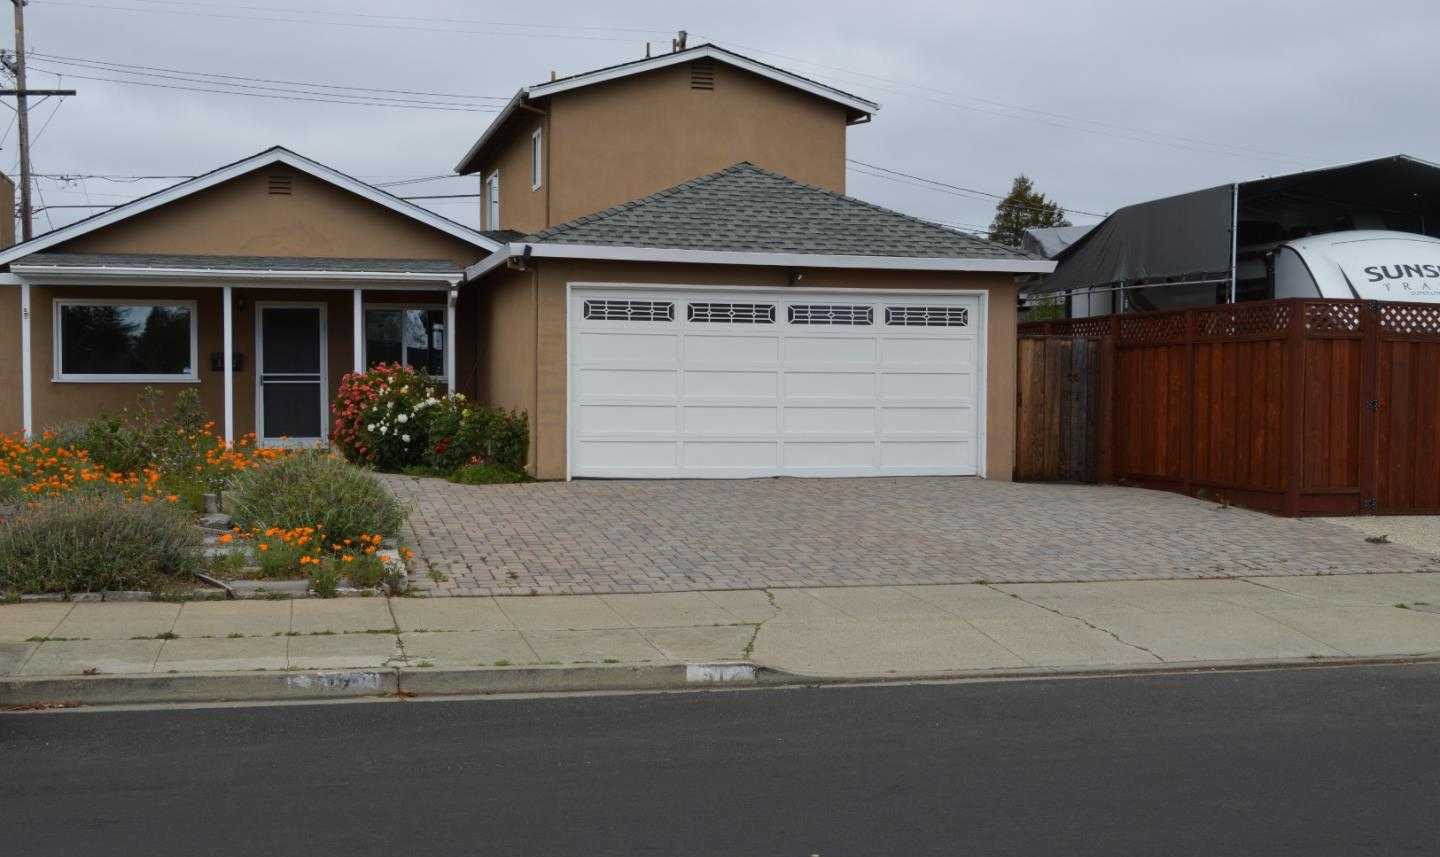
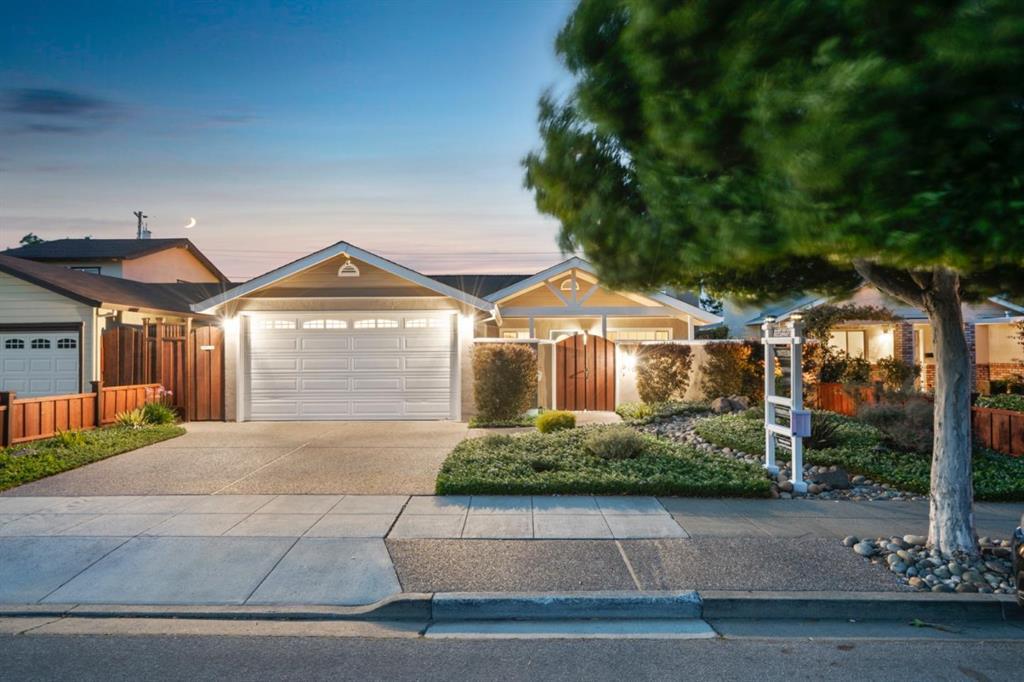
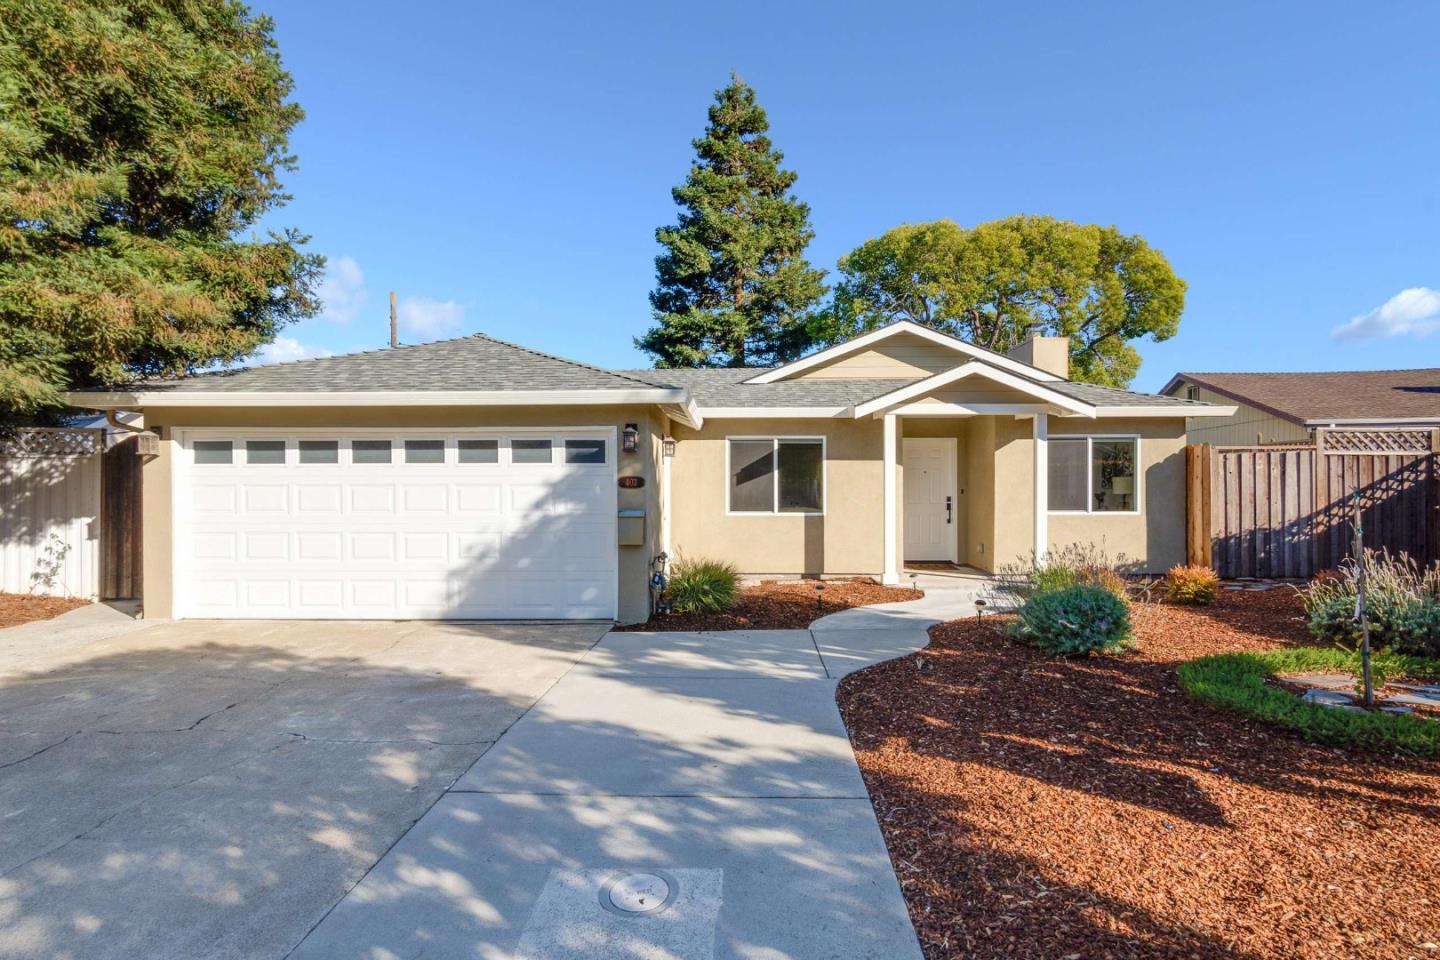
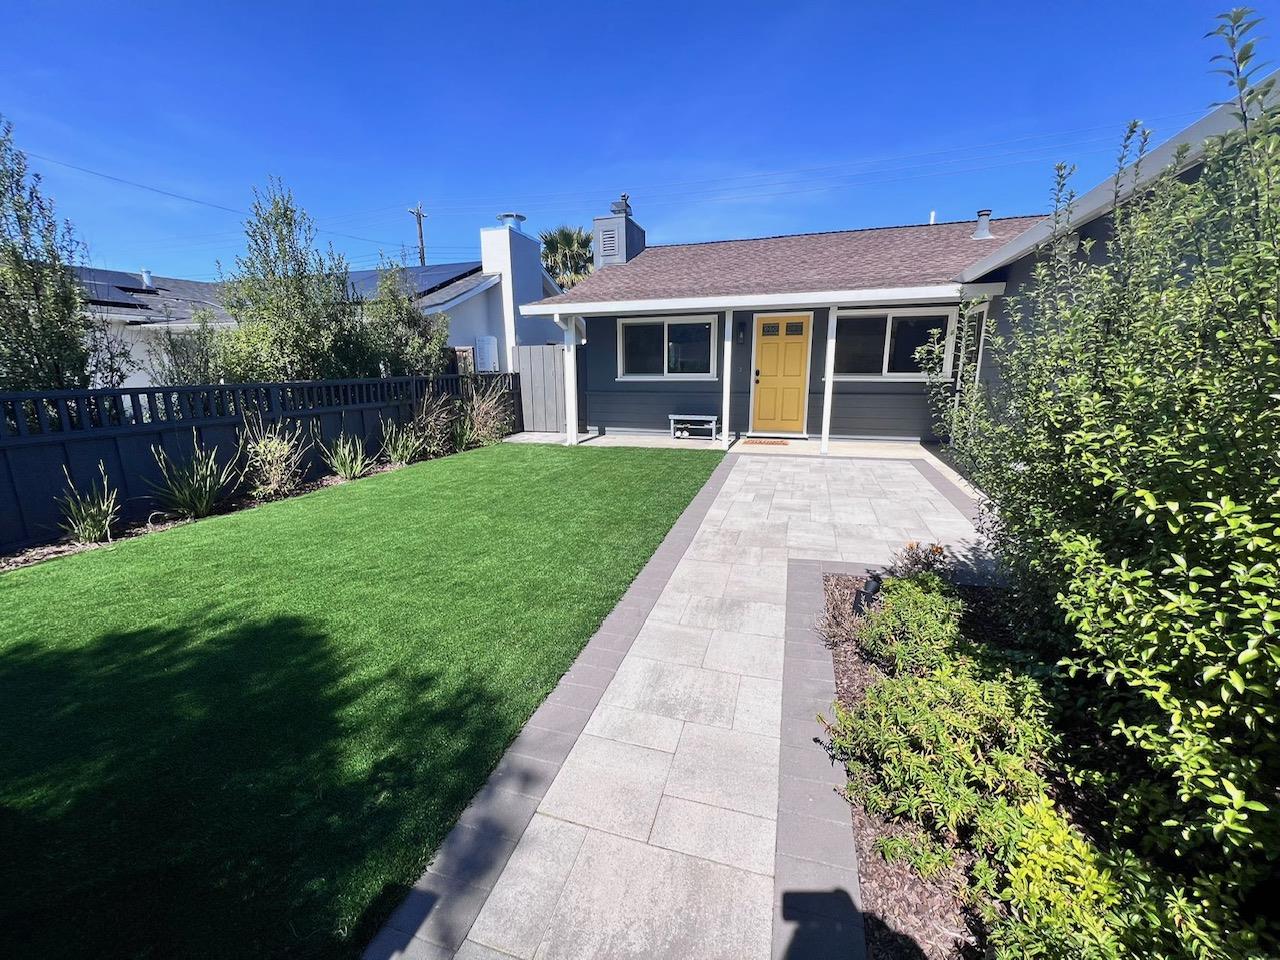
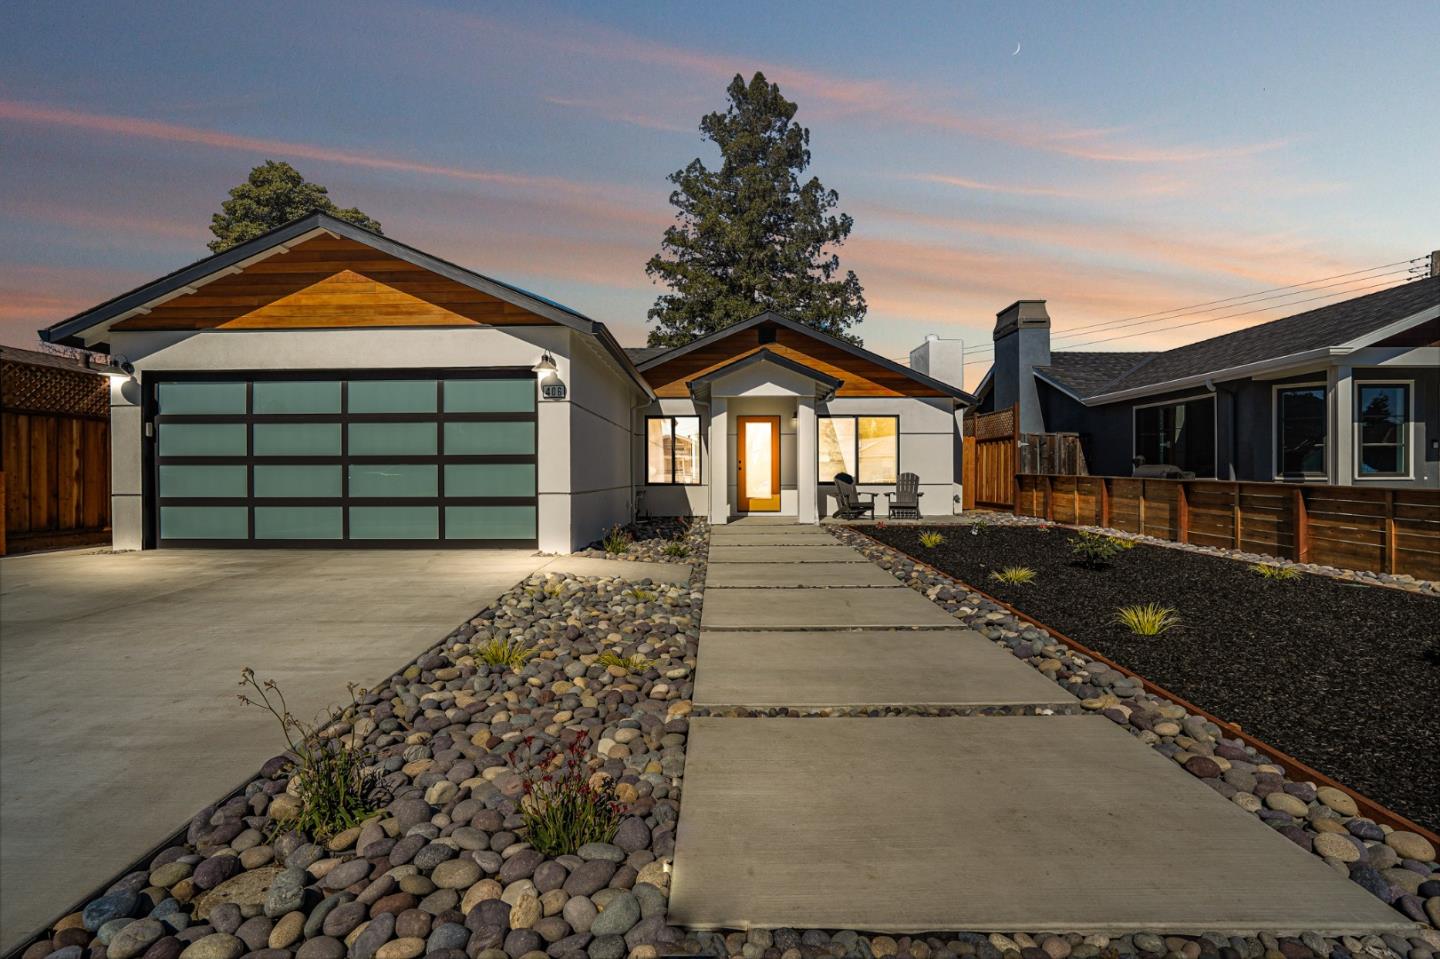
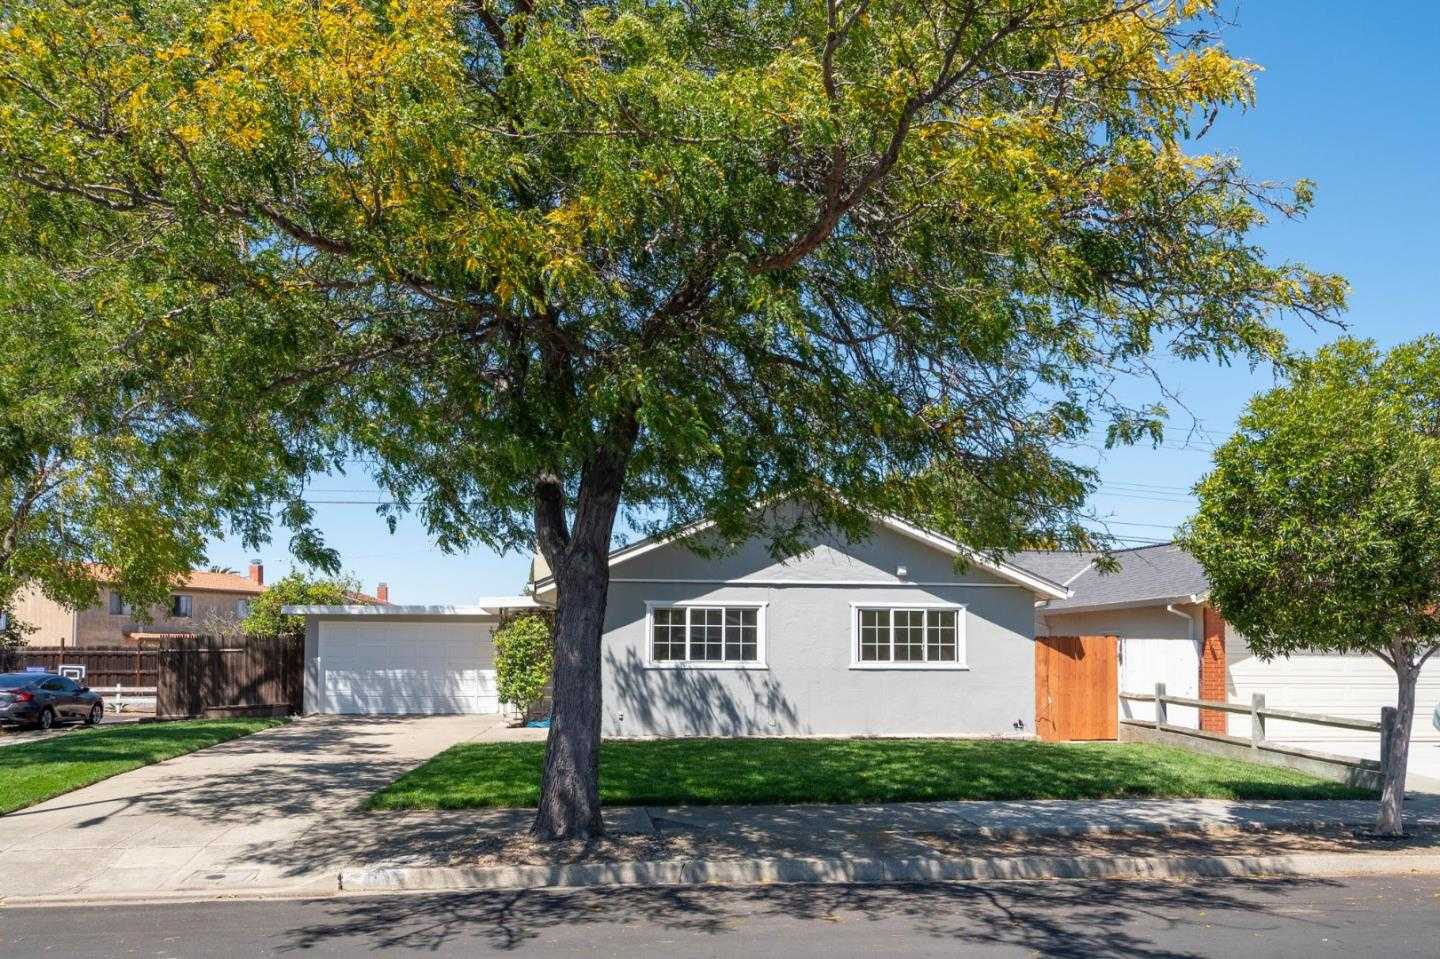
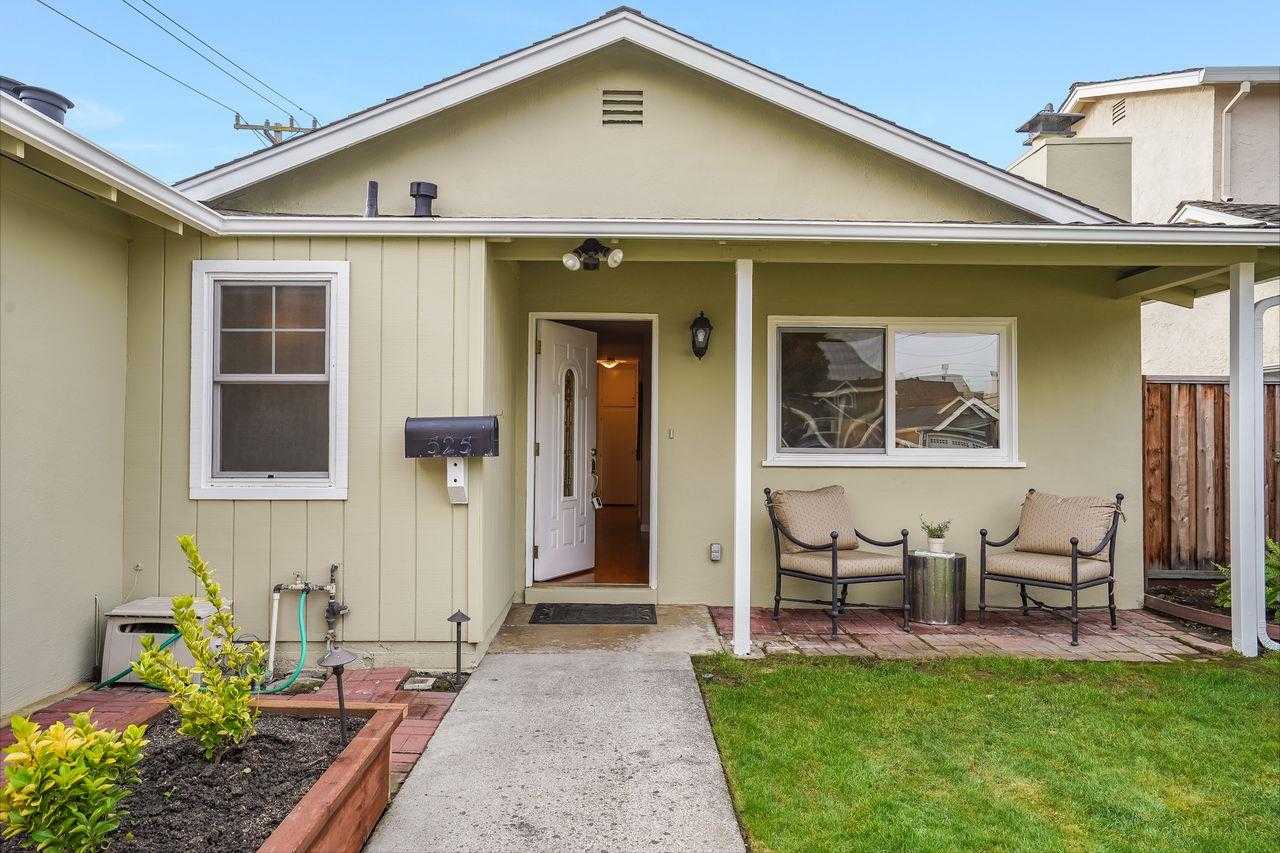
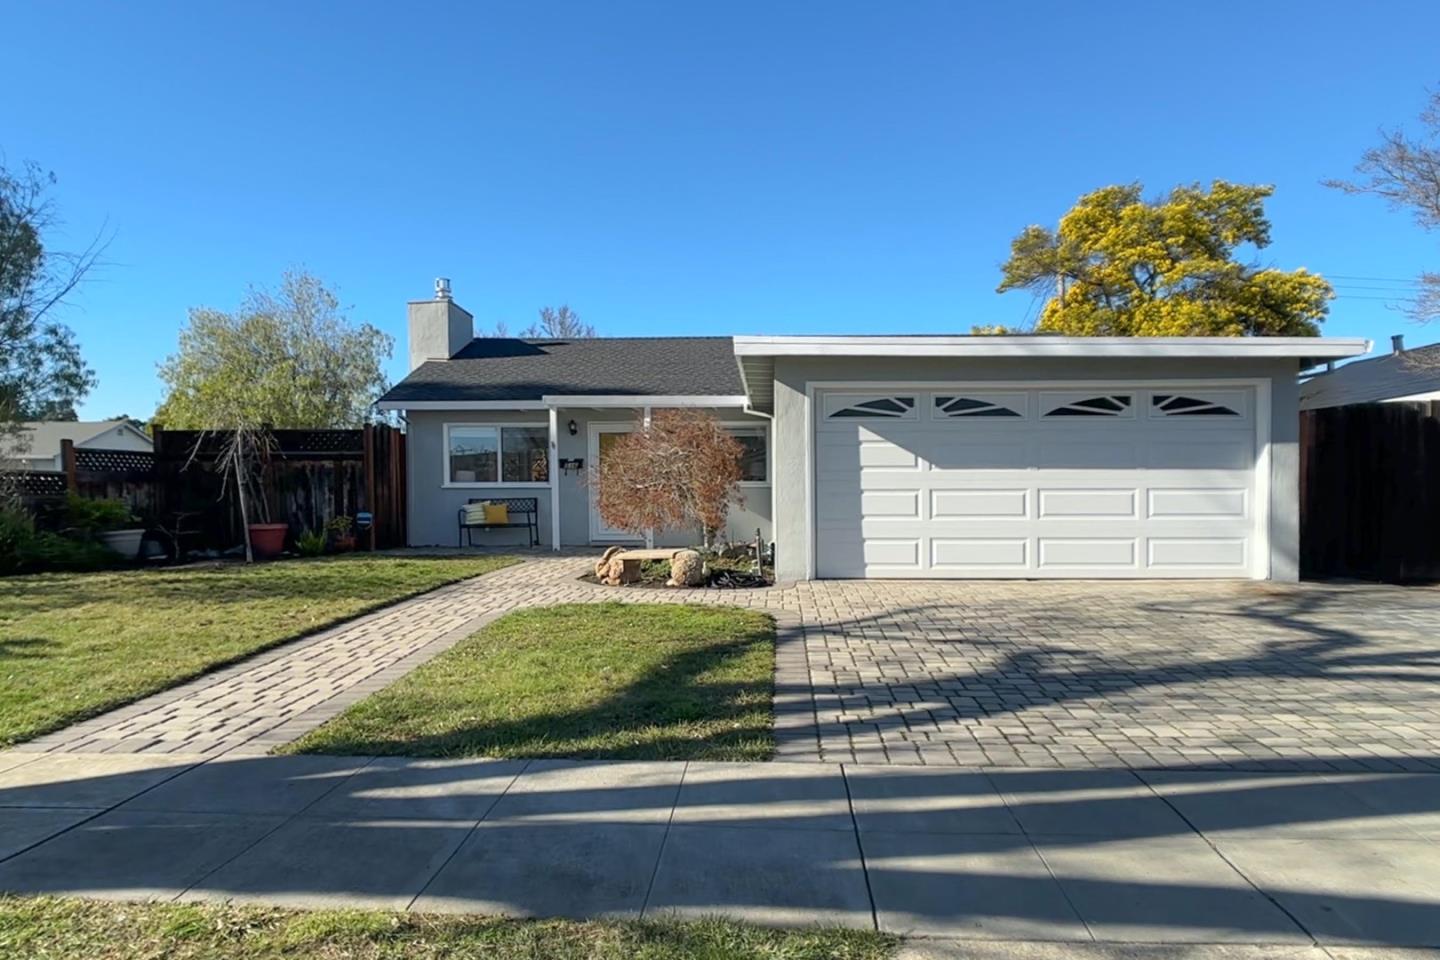
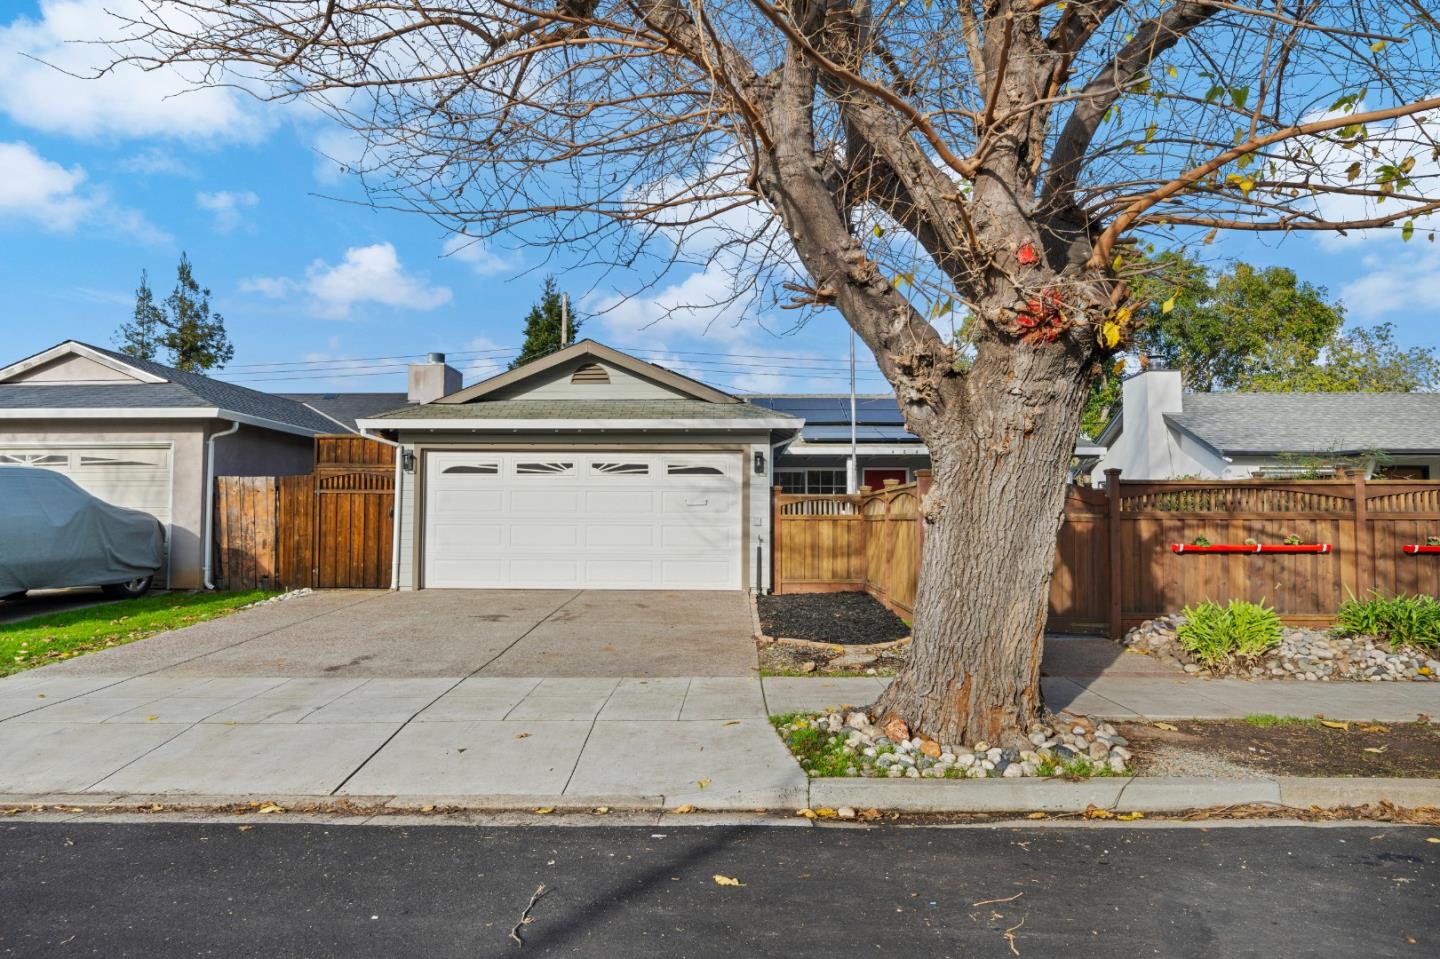
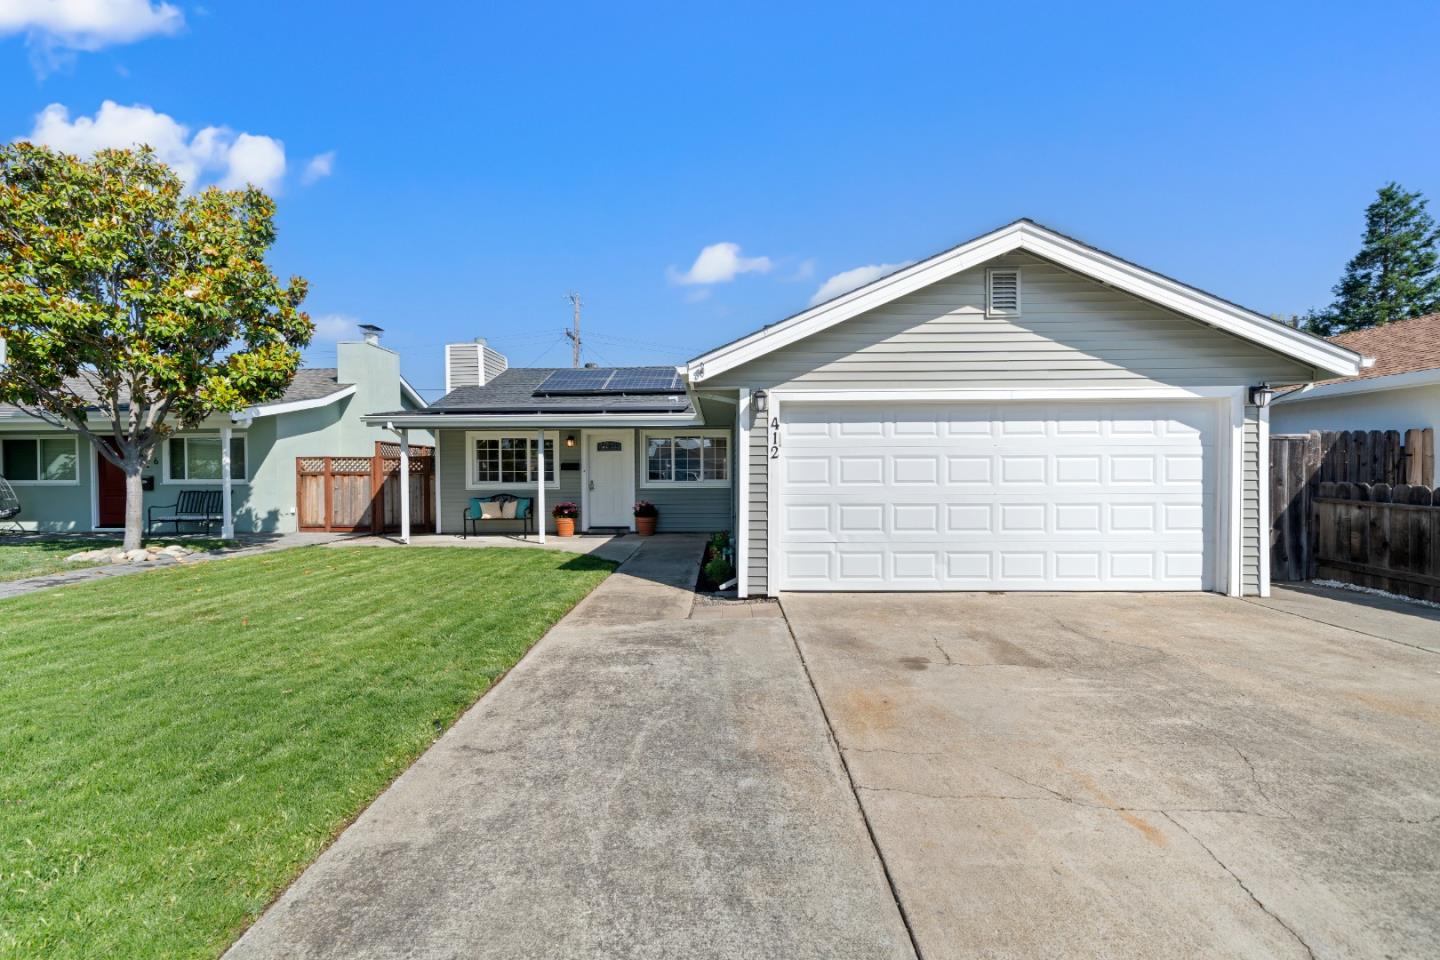
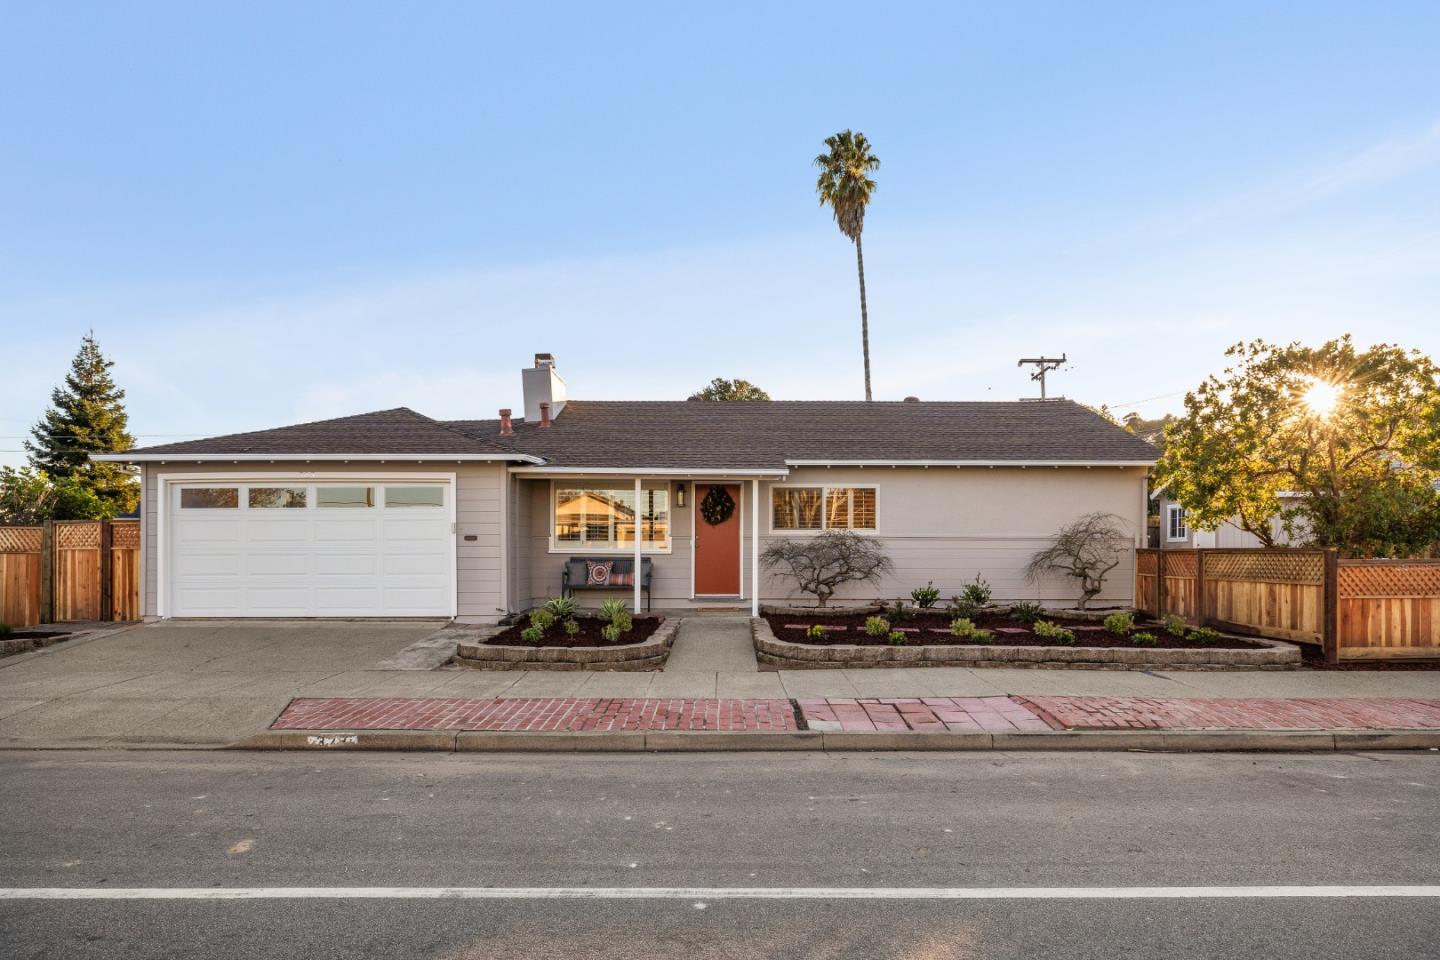
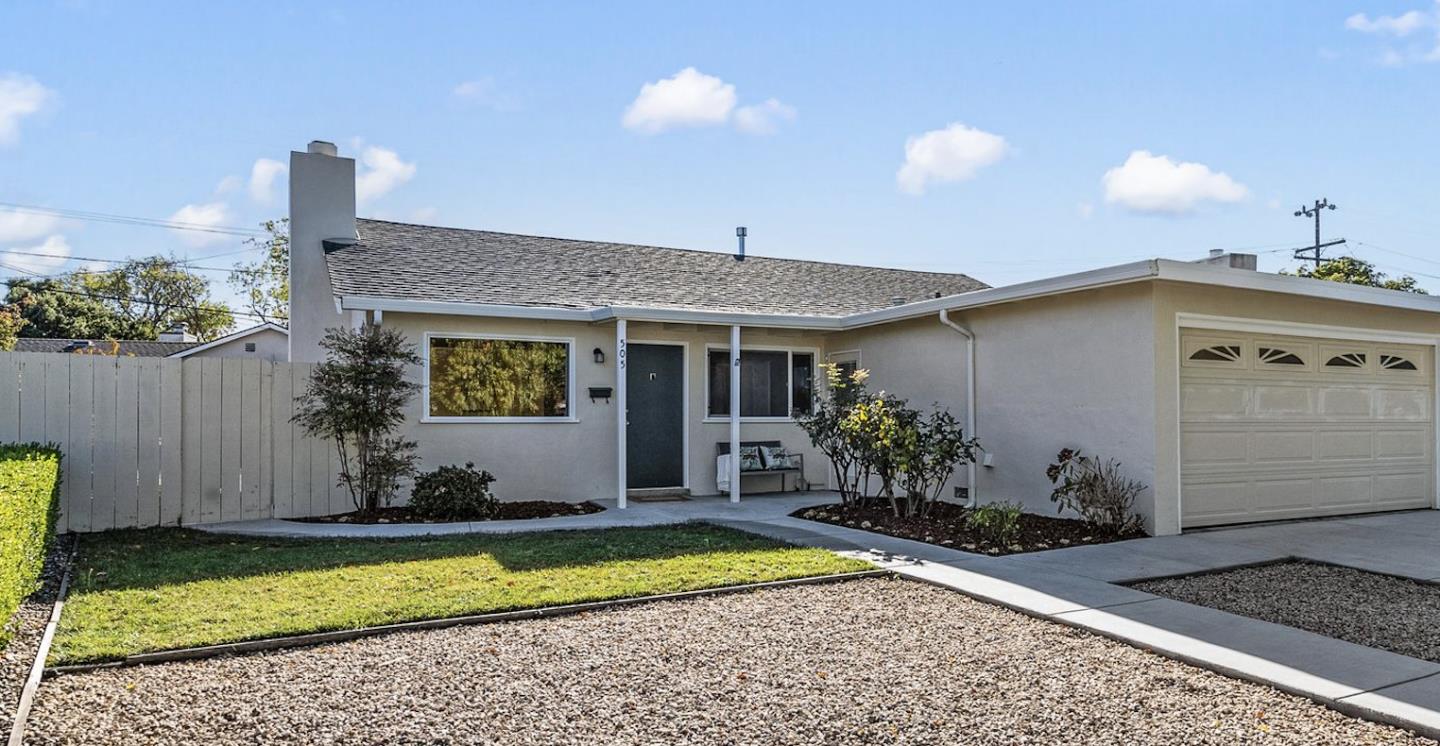
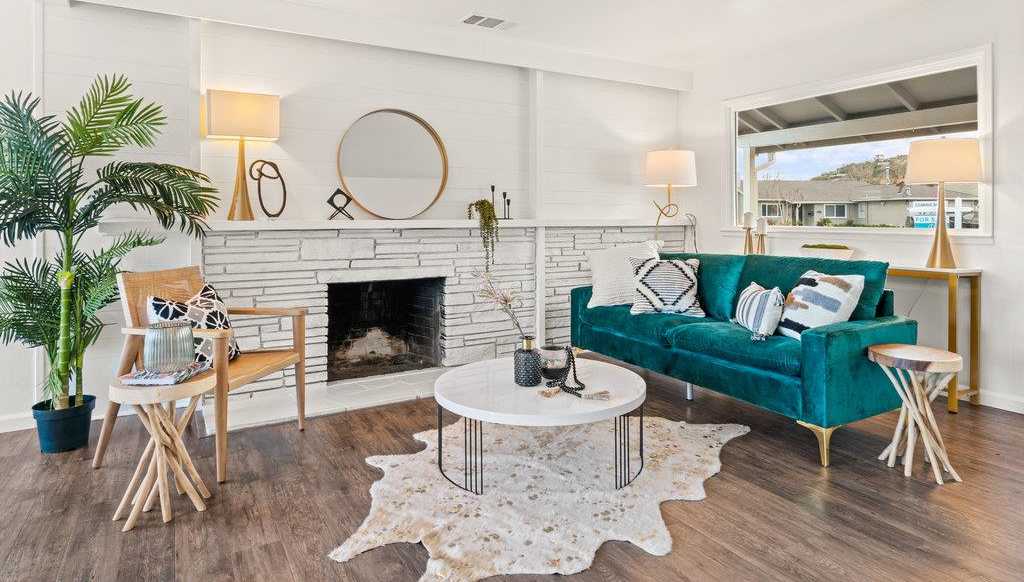
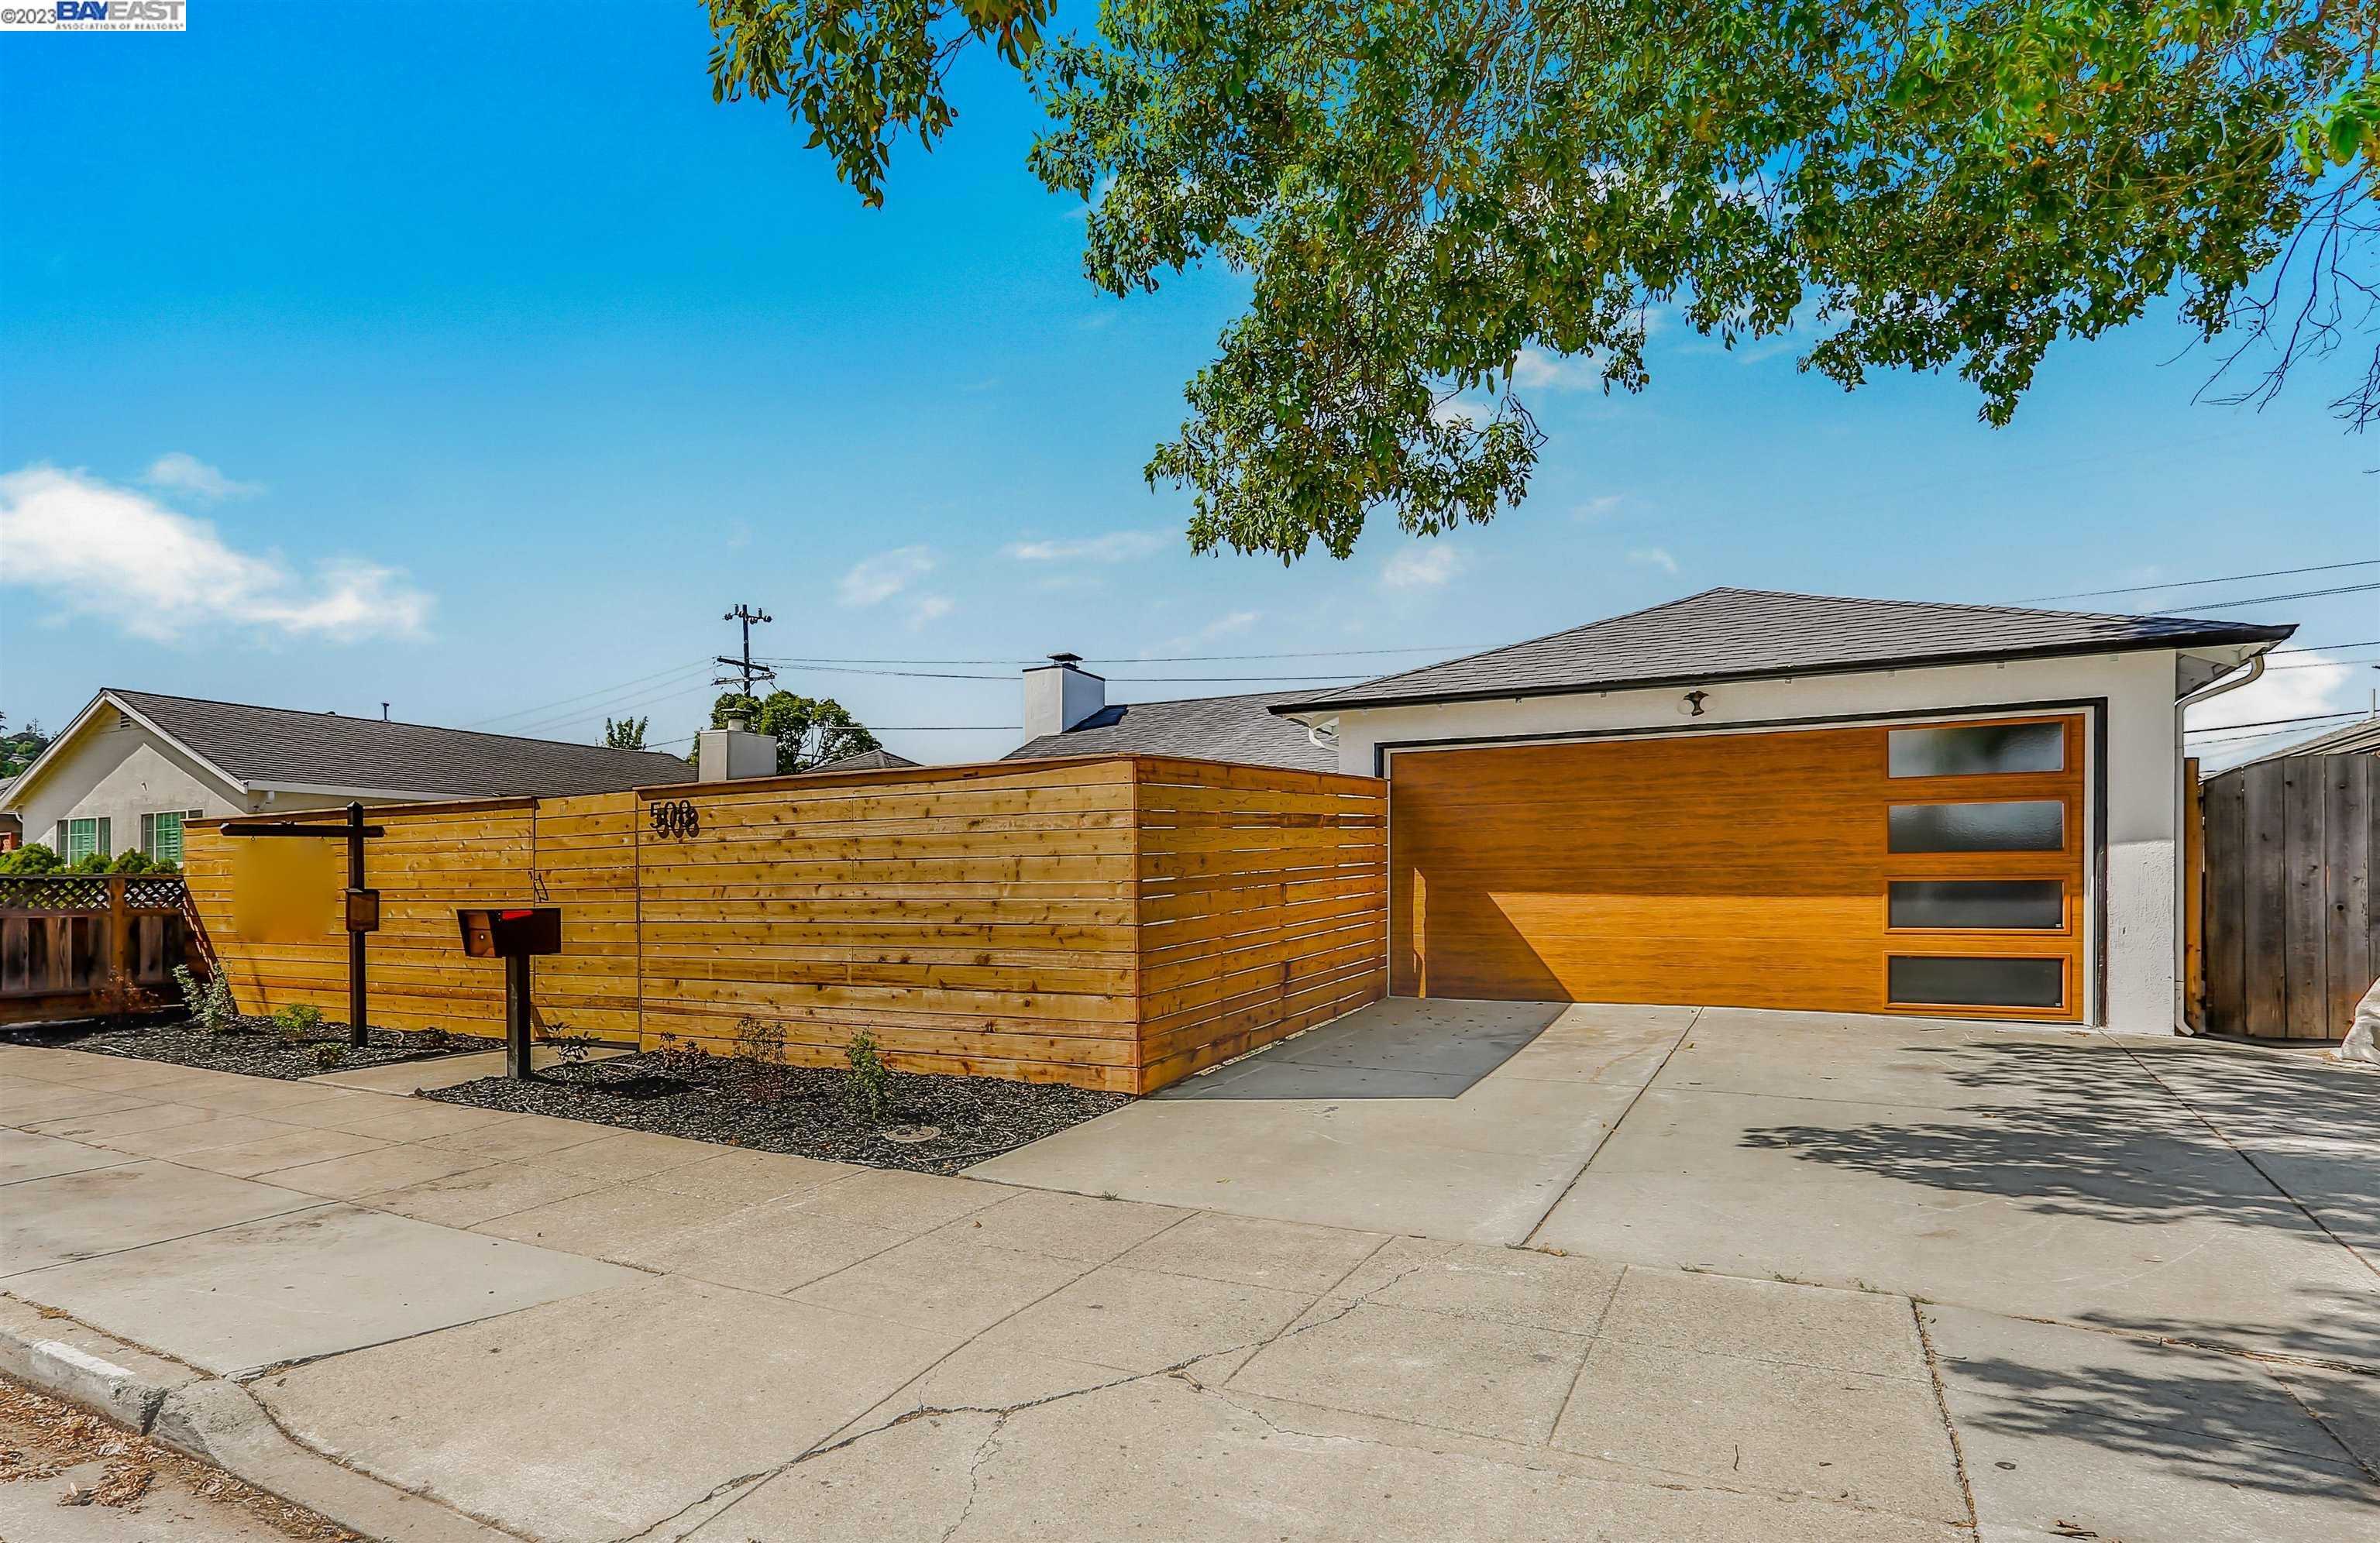
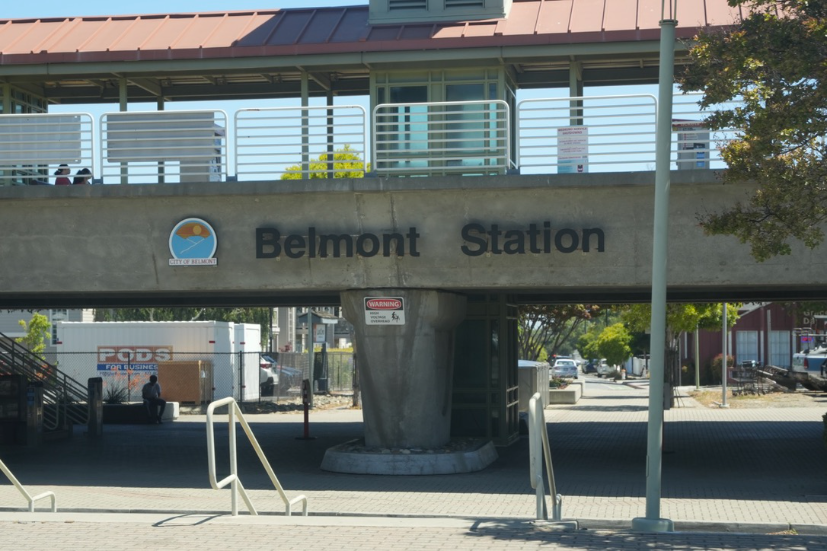
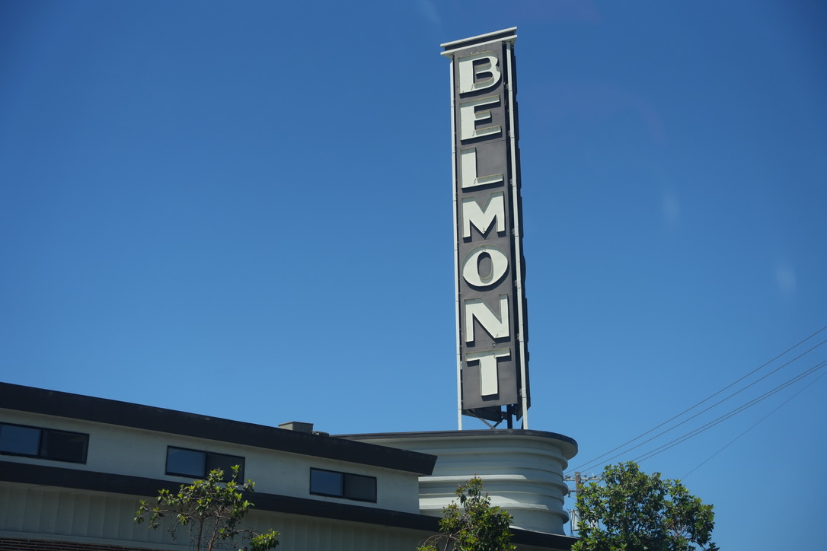
1 of 58
Schools Serving Sterling Downs
| School Name | Type | Grades | Houseberry School Score |
|---|---|---|---|
| Nesbit Elementary | Primary | K-8 | |
| Ralston Intermediate | Middle | 6-8 | |
| Carlmont High | High | 9-12 |
Click links for school listing
info at GreatSchools.org
Houseberry School Score Data
from CA Dept. of Education
Houseberry recommends using these scores as only a starting point, and conducting your own investigation into what schools fit best for your preferences. School boundaries are not guaranteed and may change. It is important to contact the appropriate school district to confirm enrollment eligibility before making any decision to move to a neighborhood.
Sterling Downs Home Prices
Sterling Downs FAQs
10 answers
Is Sterling Downs a good place to live?
Sterling Downs ranks 8th of 9 neighborhoods in Belmont with an overall Houseberry score of 3.9 out of 5. Its strongest factors are schools (4.9/5) and nearby merchants (3.6/5). The trade-off is safety (2.9/5).
Is Sterling Downs safe?
Sterling Downs, Belmont scores 2.9 out of 5 on Houseberry's Safety Score, ranking 8th of 9 neighborhoods in Belmont.
What do homes in Sterling Downs cost?
The typical home price in Sterling Downs, Belmont is $1.97M, compared with $2.35M for Belmont as a whole. Houseberry currently rates it undervalued by about $105,000 against comparable neighborhoods.
Are home prices in Sterling Downs rising or falling?
The typical home price in Sterling Downs, Belmont is up about 4.9% over the past 12 months, at $1.97M. The full 12-month history is charted in the Typical Home Price section on this page.
Which schools serve Sterling Downs?
Schools serving Sterling Downs, Belmont include Nesbit Elementary (4.8/5), Ralston Intermediate (5.0/5) and Carlmont High (5.0/5).
What is the weather like in Sterling Downs?
Sterling Downs, Belmont receives 79% of its possible sunshine, 3rd of 9 in Belmont. Summer days run 55° to 74°F and winter days 43° to 59°F, September is the warmest month and rainfall averages about 19 inches a year.
Is Sterling Downs walkable to shops and restaurants?
Sterling Downs, Belmont scores 3.6 out of 5 for nearby merchants and 3.5 out of 5 for public spaces. Its overall amenities score is 3.5 out of 5, 5th of 9 in Belmont.
What is Sterling Downs known for?
Sterling Downs, Belmont is associated with Classic Suburban, Friendly and Accessible. Its highest-scoring factor is schools (4.9/5).
How does Sterling Downs compare to other Belmont neighborhoods?
Sterling Downs ranks 8th of 9 neighborhoods in Belmont. It ranks 7th of 9 in Belmont for schools (4.9/5) and scores lowest on safety (2.9/5). The next-ranked neighborhoods in Belmont are Homeview.
What are the downsides of living in Sterling Downs?
Sterling Downs, Belmont scores lowest on safety (2.9/5).
1 of 58
Sterling Downs Map
View Full Map
All information provided on this website including but not limited to - school ratings, safety, amenities, user opinions, and property data - is for general informational purposes only. We do not guarantee its reliability, accuracy, or completeness. Users should independently verify information and consult appropriate professionals as needed. By using this website, you agree Houseberry is not responsible for actions, decisions, or consequences arising from reliance on the information provided
houseberry.com - CA DRE# 01847391
 Bay East ©2025. CCAR ©2025. bridgeMLS ©2025. Information Deemed Reliable But Not Guaranteed. This information is being provided by the Bay East MLS, or CCAR MLS, or bridgeMLS. The listings presented here may or may not be listed by the Broker/Agent operating this website. This information is intended for the personal use of consumers and may not be used for any purpose other than to identify prospective properties consumers may be interested in purchasing. Data last updated at October 2, 2026 12:00 AM