Bay Area Earthquake Risk: What Matters for Your Home
A trillion-dollar quake estimate made the rounds this week. Here is the Bay Area's own scenario, what soft-story and liquefaction actually mean for a specific address, and what insurance costs.
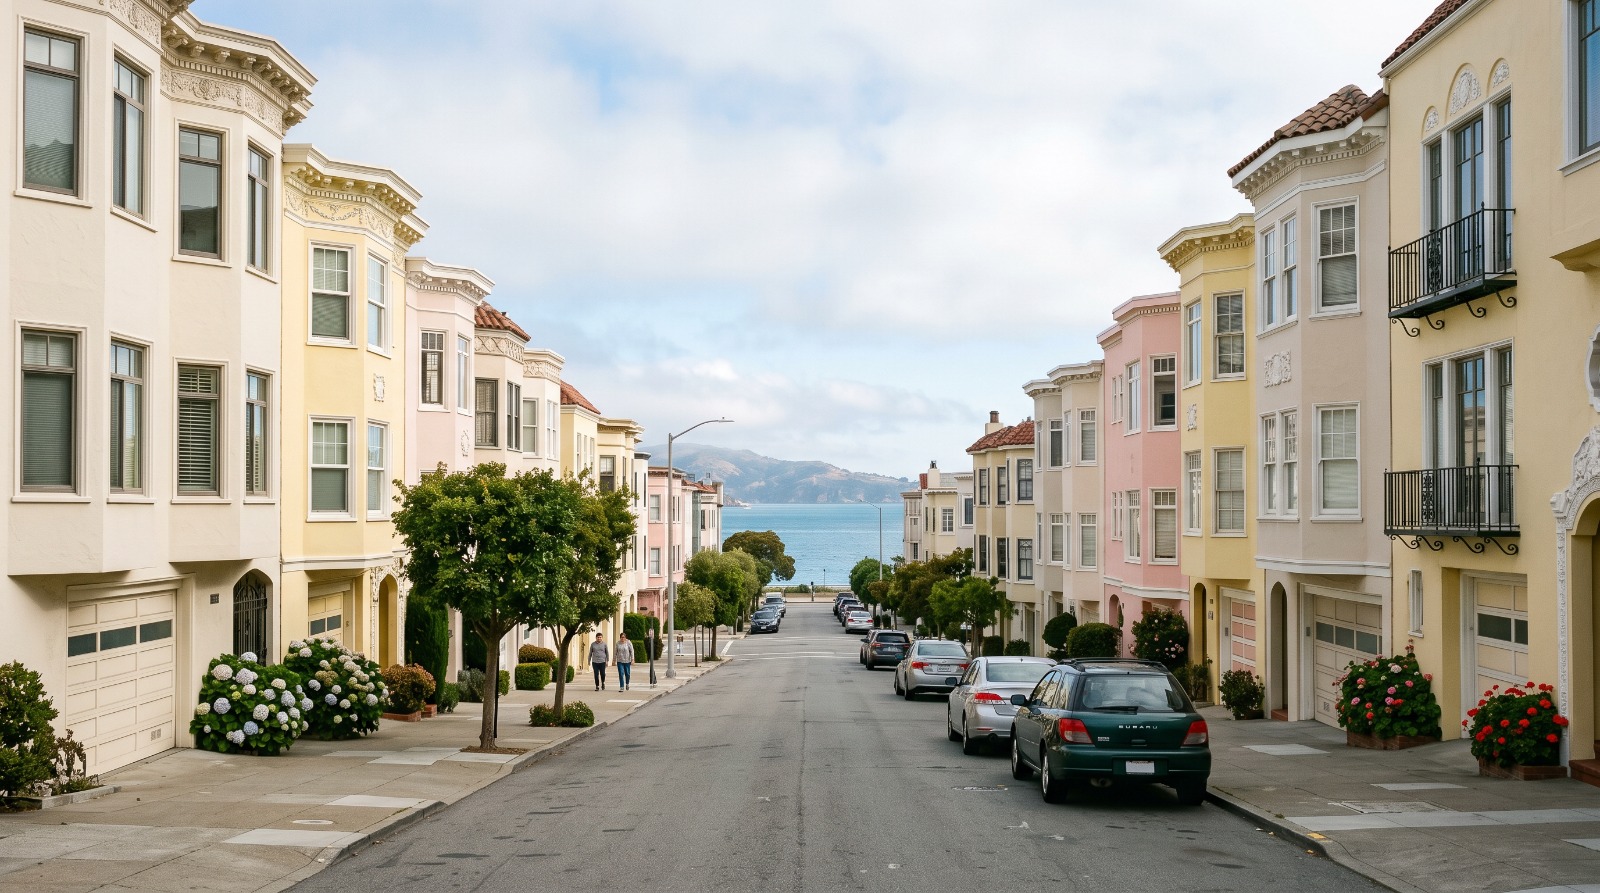
Pastel 1920s homes on a flat Marina District street in San Francisco, an area the state hazard maps place on artificial fill. Photo: Houseberry
A trillion-dollar earthquake number went around the Bay Area this week, and the question underneath it is smaller and much more answerable than the headline suggests. People are not really asking how much California would lose. They are asking whether the specific house they live in, or the one they are about to make an offer on, is a problem.
That question has three parts, and all three have real answers you can look up this afternoon. Is the building itself a known weak type. What kind of ground is it sitting on. And what does insurance actually cost against what it actually pays. The headline number, it turns out, is not about the Bay Area at all.
Before any of that, one piece of arithmetic worth carrying around: in the federal government's own Bay Area earthquake scenario, only 9 percent of residential building damage would be covered by insurance. Not because coverage does not exist. Because almost nobody buys it.
Where the trillion-dollar number came from
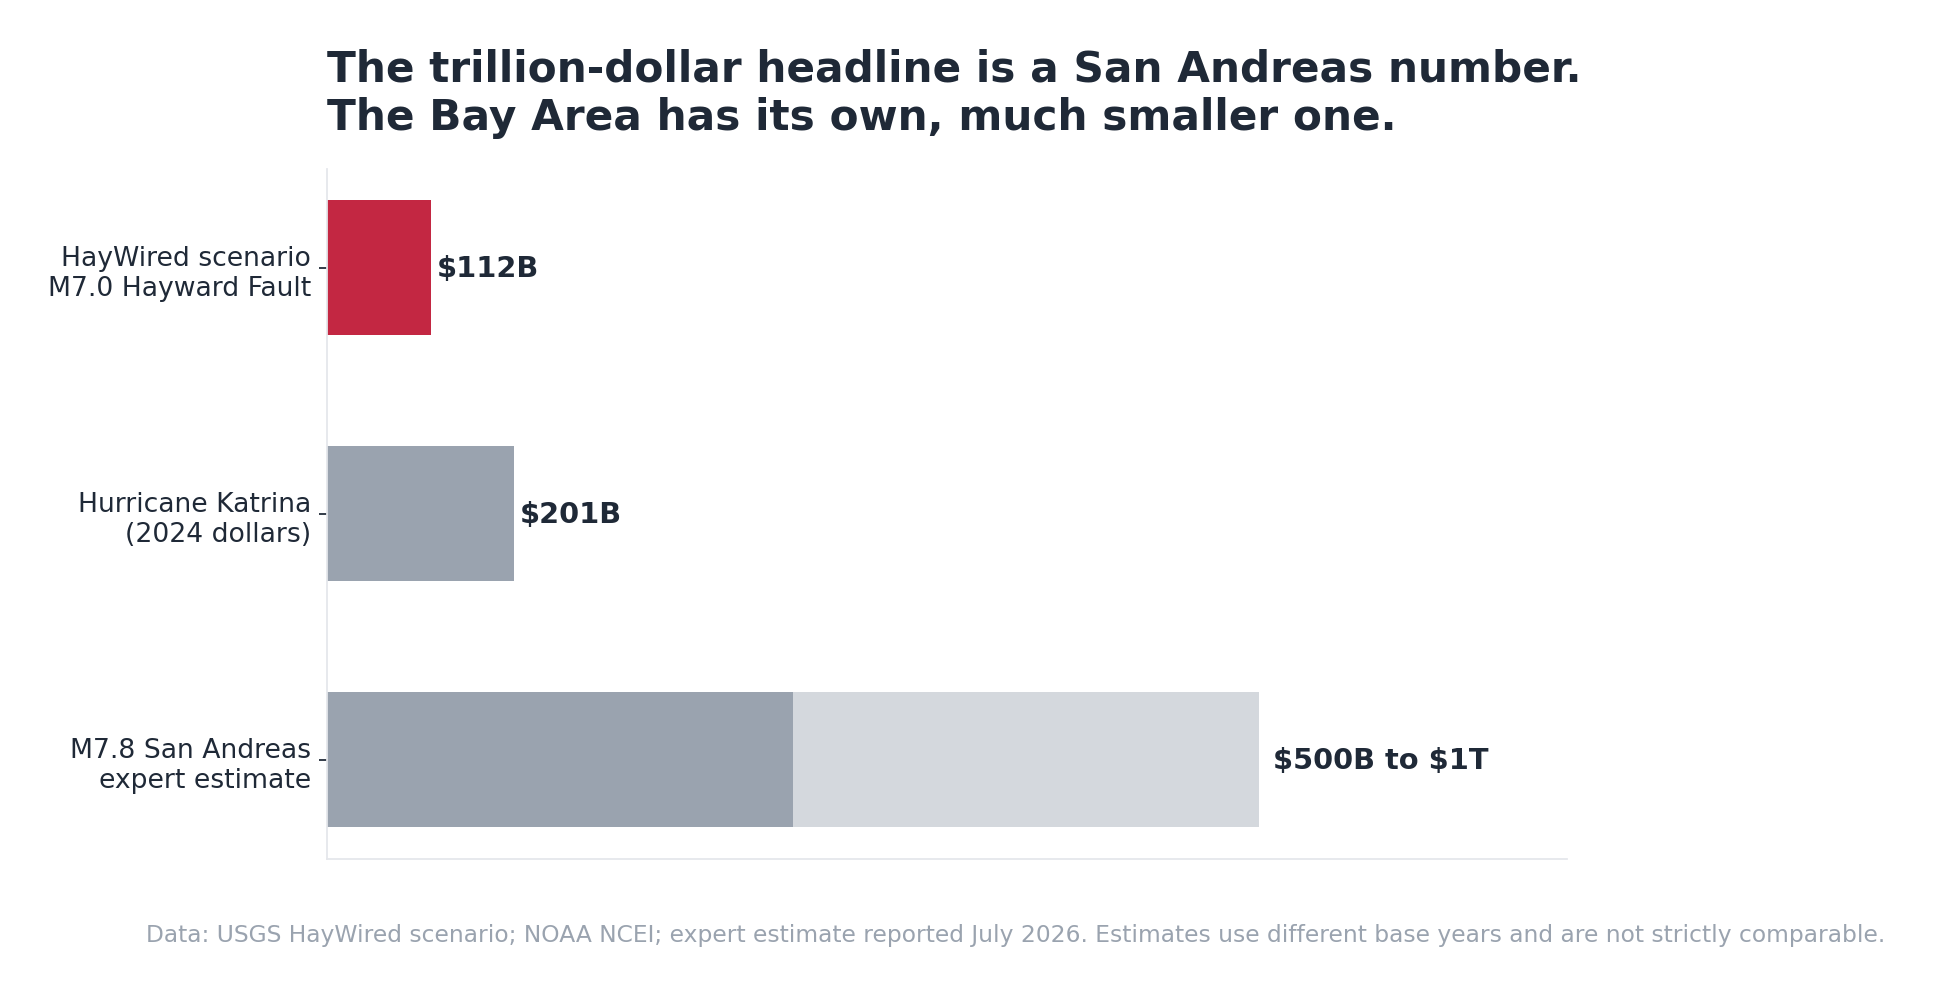
Ahmed Elbanna, who directs the Statewide California Earthquake Center, told the state's Seismic Safety Commission in late July that a magnitude 7.8 earthquake could cause between $500 billion and $1 trillion in damage, which would make it the costliest disaster in United States history. For scale, Hurricane Katrina caused about $201 billion in 2024 dollars, per NOAA, and it still holds the record.
Two things about that estimate deserve to be said plainly, because they change how much weight it should carry.
First, the fault is the San Andreas, not the Hayward. A magnitude 7.8 San Andreas rupture is the ShakeOut scenario, and in seismological practice that scenario is centered on Southern California. It is a statewide number that includes Los Angeles. It is not a forecast for what happens here.
Second, no published model sits behind it. There is no report, no slide deck, no peer-reviewed loss study attached to the $500 billion to $1 trillion range. It is expert testimony relayed by press, from someone with the standing to give it, which is not nothing but is also not the same thing as a modeled output. Treat it as a director of a research center giving a legislature a magnitude, not as a number you can plan against.
The Bay Area has its own scenario, and it is far more specific
The number that actually describes this region is HayWired, a US Geological Survey scenario modeling a magnitude 7.0 on the Hayward Fault with an epicenter in Oakland. It is not a prediction of when. It is a detailed engineering study of what, and it is the document every emergency planner in the region works from.
HayWired projects more than $82 billion in property and business interruption losses from shaking, liquefaction and landslides, plus roughly $30 billion in fire losses from about 450 large fires, with a burned floor area equivalent to more than 52,000 single-family homes. It models 800 deaths and 18,000 injuries, and it estimates that more than 400,000 people, about 150,000 households, would be displaced. East Bay water service would be out for an average of six weeks and in some places up to six months.
The building numbers are the ones worth sitting with, because they are the least alarming and the most useful. In the scenario, 0.4 percent of code-compliant buildings collapse. Five percent become unsafe to occupy and 19 percent have restricted use. That is a very different picture from the one the word catastrophe puts in your head. Most buildings stand. A meaningful minority become unusable for a while, and the difference between those two outcomes is largely about what kind of building it is.
On timing, the honest answer is that nobody knows. The USGS forecast published in 2015 put the probability of a magnitude 6.7 or larger somewhere in the Bay Area at 72 percent over 30 years, and 33 percent on the Hayward Fault specifically. Roughly twelve years of that window have already passed. It is a useful number for deciding whether to spend $3,000 on foundation bolts. It is not a useful number for deciding what month to buy a house.
Soft story is the one thing you can look up about a specific building
A soft-story building is a wood-frame building whose ground floor is mostly openings. Tuck-under parking, garage doors, wide storefront glass, all in the place where a solid wall would normally be. Under sideways shaking the weak floor can fail while the floors above stay largely intact. In Loma Prieta, roughly half the homes destroyed were this type.
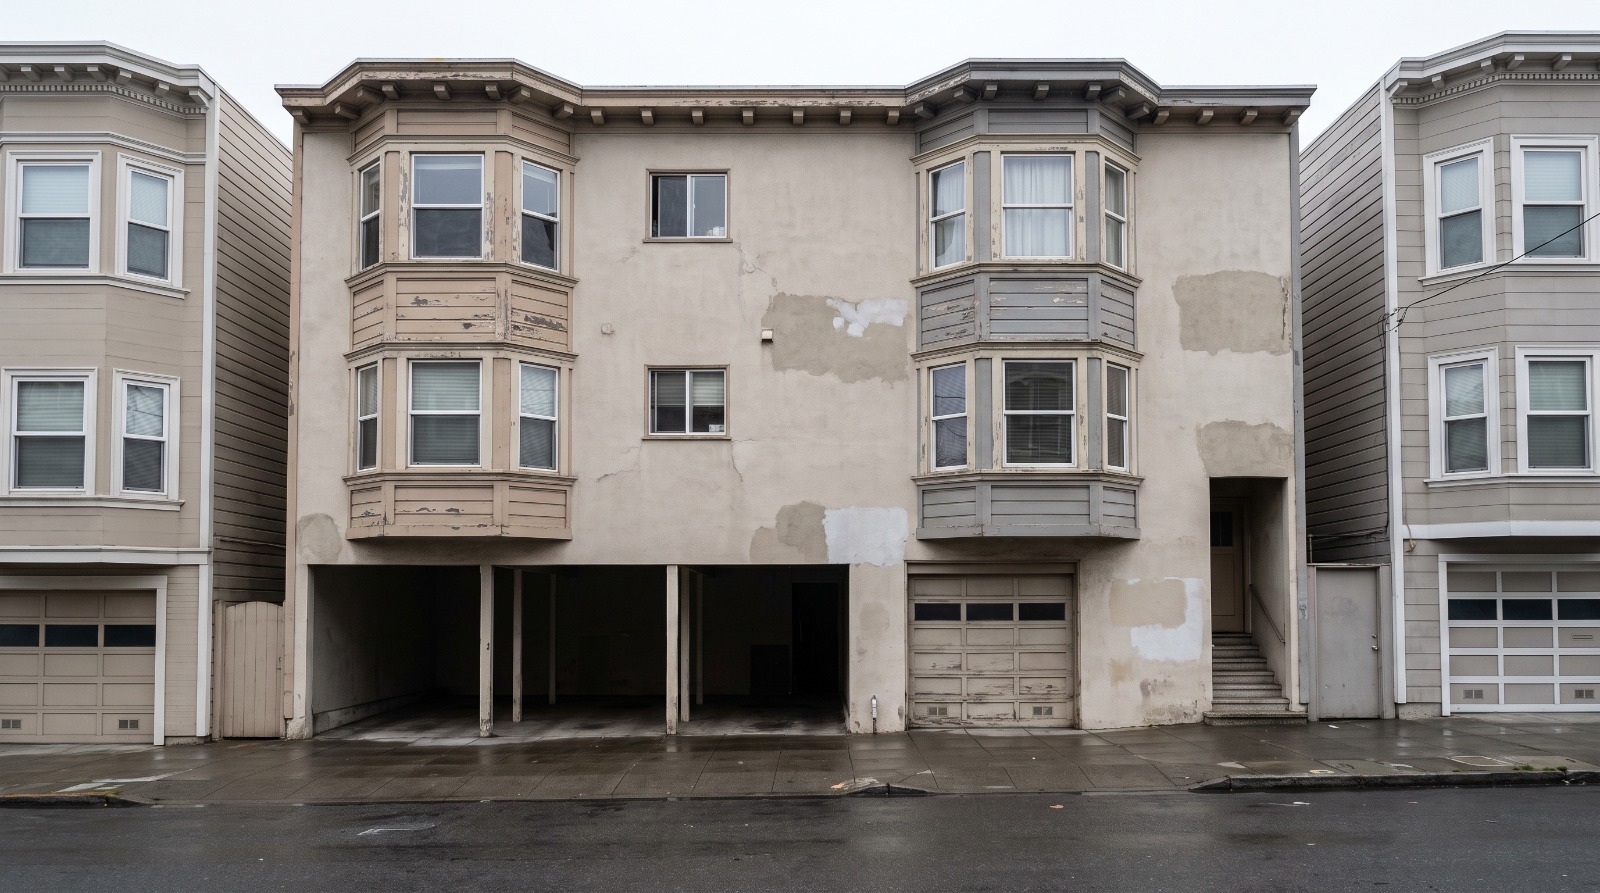
Four Bay Area cities have taken four different approaches, and where each one stands is public information that almost nobody checks before they buy.
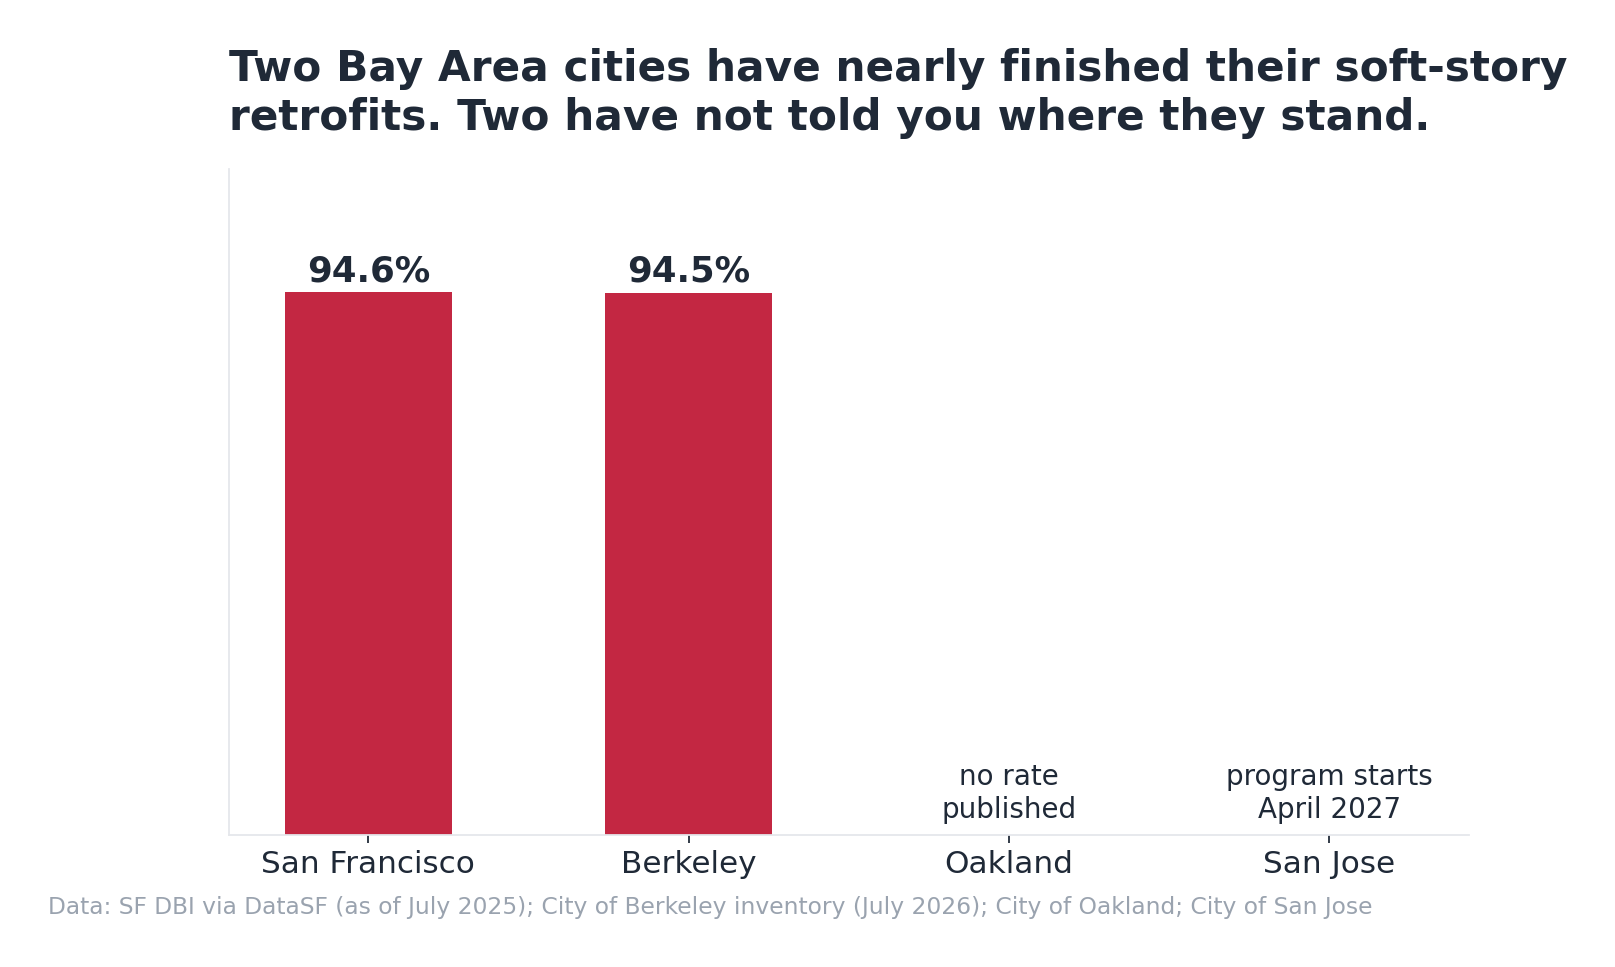
San Francisco's Mandatory Soft Story Program is nearly finished. City building department data shows 4,678 of 4,945 listed buildings with retrofit work complete and a certificate issued, about 94.6 percent, with 262 still non-compliant. All four compliance tiers passed their deadlines between 2017 and 2022. Berkeley is in the same place, with 293 completed retrofits and 7 buildings out of compliance as of July 2026.
Oakland is the gap. Its ordinance took effect in January 2019 with three tiers, and the last deadline passed on February 21, 2025. The city publishes a list of subject properties, most recently updated in May 2026, but it does not publish a compliance rate. That absence is itself the finding. San Jose is further back still: its ordinance was adopted in September 2024 but does not take effect until April 1, 2027, with final retrofit deadlines running out to 2033. Roughly 8,000 units are in scope and the clock has not started.
Checking a specific address is straightforward. San Francisco maintains a public map of soft-story properties through DataSF, updated from building department records. Oakland's list is a searchable PDF on the city site. Berkeley publishes its full inventory with each building's status. If you are looking at a two-to-four unit building with parking underneath in any of these cities, that lookup takes about ninety seconds and it is the single highest-value thing you can do.
One caution. San Francisco's own program landing page still says over 700 owners have finished, which is off by a factor of six against the city's live dataset. Use the dataset, not the summary page.
The ground underneath, and one myth worth correcting
California maps this, and the maps are free. The Seismic Hazards Mapping Act of 1990 produced Seismic Hazard Zones for liquefaction and earthquake-induced landslide. The Alquist-Priolo Act of 1972 produced Earthquake Fault Zones for surface rupture. Both are searchable by address in the California Geological Survey's EQ Zapp viewer.
What the maps show, consistently, is that the greatest hazard is old artificial fill, particularly fill placed decades ago over what used to be bay floor, along with loose soils in former stream channels. USGS names San Francisco, Oakland and Alameda Island as the places where that fill is concentrated, and points to the Marina District building failures and the Cypress Viaduct collapse in West Oakland, both in 1989, as what it looks like in practice.
Here is the correction. San Francisco Bay Mud is not the villain of this story. When Witter and colleagues remapped the region for USGS in 2006, they classified Bay Mud as only moderate liquefaction susceptibility. Its real hazard is that it amplifies shaking, which is a different problem with different fixes. The very high ratings belong to the artificial fill placed on top of it. If you have heard that Bay Mud liquefies, that is the shorthand and it is wrong.
And a framing rule that matters more than any of the above: being inside a mapped zone is not a prediction about your house. Regulatorily it means a site investigation may be required at permitting and that appropriate design or ground improvement has to be applied. Plenty of well-built buildings sit in zones and plenty of poorly built ones sit outside them.
Does the market price any of this? Mostly no.
This is where our own data says something that surprised me.
| Neighborhood | What the state hazard maps show | Median home price | Month |
|---|---|---|---|
| Marina, San Francisco | Artificial fill, the 1989 liquefaction failure site USGS names | $5.09M | July 2026 |
| Pacific Heights, San Francisco | Bedrock hill, a mile away | $4.53M | June 2026 |
| San Francisco citywide | Mixed | $1.64M | July 2026 |
| Montclair, Oakland | Oakland Hills bedrock | $1.35M | June 2026 |
| Jingletown, Oakland | Estuary shoreline fill and alluvium | $474,030 | July 2026 |
The Marina sits on the fill that USGS singles out by name, and it traded at about $5.09 million in July 2026, roughly three times the San Francisco citywide median of $1.64 million that month. Pacific Heights, on solid rock a mile south, came in lower at about $4.53 million in June. Views, blocks and light are doing the pricing. Ground condition is not visible in the number at all.
The East Bay looks like the opposite result and is not. Montclair on bedrock runs $1.35 million against Jingletown on estuary fill at $474,030, a 2.8x gap. But Montclair scores 5.0 on safety and Jingletown 2.1, and their school scores are just as far apart. That spread tracks income and services, not geology. I would not use it as evidence either way.
The defensible conclusion is a narrow one, and it is useful. A buyer is not compensated with a discount for taking on mapped ground risk, and is not charged a premium for avoiding it. Which means the hazard maps are free information the market has already declined to price in. That is unusual, and it is a good reason to look them up yourself rather than assuming the price told you something.
What insurance costs, and the deductible nobody mentions
About 12.5 percent of California residential policies carried earthquake coverage in 2025, or 1,591,648 out of 12,754,225, according to the state Department of Insurance. Roughly one home in eight. The California Earthquake Authority writes about 61 percent of that market.
Average annual premium is easier to compute than most articles admit. California homeowners paid $1,327,914,241 across 922,090 homeowners earthquake policies in 2025, which works out to about $1,440 a year. Bay Area premiums run higher than that average because they are rated on location, age, construction and dwelling limit, and third-party quotes for San Francisco in the $2,000 to $5,000 range show up regularly. Those come from comparison sites rather than the regulator, so use CEA's own calculator rather than any published range.
The number that actually decides whether the policy is worth it is the deductible. CEA deductibles are 5, 10, 15, 20 or 25 percent of the dwelling limit. Homes with dwelling coverage above $1 million, and pre-1980 homes on raised foundations without a verified retrofit, are restricted to the 15, 20 and 25 percent tiers only.
Work that through. A $1 million dwelling limit at a 15 percent deductible means $150,000 out of pocket before the policy pays a dollar. That is the real product. It is catastrophe coverage for the case where the house is a total loss, not repair coverage for cracked drywall. Loss of use and the first $1,500 of emergency repairs carry no deductible, and there is a standard $10,000 for building code upgrades, but the main coverage sits behind that wall.
One correction worth making because it comes up constantly: fire following an earthquake is a homeowners claim, not an earthquake claim. Given that HayWired attributes roughly $30 billion of its total to fire, that distinction covers a lot of ground.
Every company writing residential property insurance in California has to offer earthquake coverage and repeat the offer every other year. If you have one sitting in a drawer, you have 30 days from a written offer to accept it.
Two grants most owners have never heard of
This is the part I would put in front of anyone in a pre-1980 house on a crawl space.
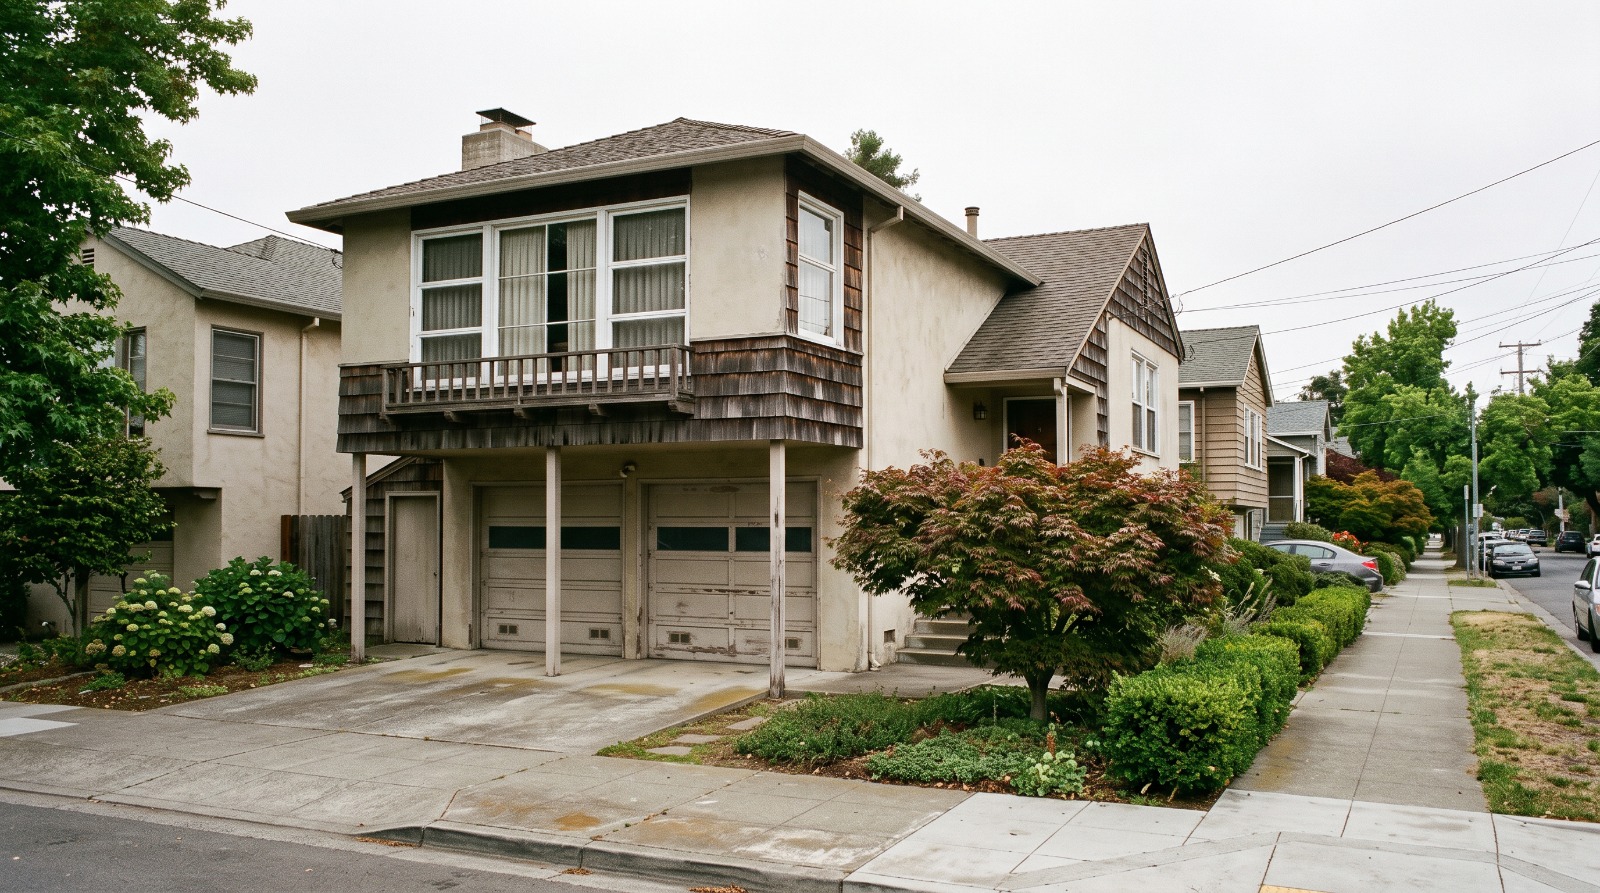
Earthquake Brace and Bolt offers up to $3,000 toward a standard retrofit: cripple wall bracing, foundation bolting, and water heater strapping. Eligibility is a pre-1980 wood-framed house on a raised foundation or crawl space in a participating ZIP code, and non-owner-occupied properties became eligible in 2025. More than 23,000 California homes have been retrofitted through it. Income-qualified households can get a supplemental grant covering up to the full cost.
The one almost nobody knows about is the Earthquake Soft-Story grant, worth up to $13,000. It covers houses built before 2000 with living space over an attached garage, up to two stories, owner-occupied or up to four units on a continuous perimeter foundation. That describes an enormous share of Bay Area single-family housing, particularly in the Sunset, the Richmond, and post-war East Bay tracts.
Costs, for calibration. A standard brace-and-bolt runs about $3,000 to $7,000 with a licensed contractor, so a $3,000 grant covers a real fraction of it. A structural engineer's assessment runs $2,000 to $8,500, and a building inspection $200 to $600. Multi-unit soft-story work under a city mandate is a completely different order of magnitude, $150,000 to $400,000 per property in San Francisco, which is why those programs took a decade.
And the compounding piece that makes the math work: a verified retrofit earns up to 25 percent off a CEA premium and lifts the deductible restriction on pre-1980 raised-foundation homes. So a few thousand dollars of bolts can improve both what you pay and what you would owe in a claim. Registration windows for both grant programs open and close, so check the California Residential Mitigation Program site rather than trusting a date you read anywhere, including here.
How to actually think about this
The disclosure a seller hands you in a California sale covers six hazards, two of them seismic: whether the property is in an Alquist-Priolo Earthquake Fault Zone and whether it is in a Seismic Hazard Zone. That is genuinely useful and it is also frequently misread. It tells you what zone the dirt is in. It tells you nothing about whether the house is bolted to its foundation, whether the cripple walls are braced, or whether the ground floor is mostly garage door. Those are separate questions and they need a separate look.
So the practical sequence, in the order I would do it. Look the address up in EQ Zapp to see the mapped zones. If it is a multi-unit building with parking underneath in San Francisco, Oakland or Berkeley, check the city soft-story list. Ask the seller directly whether a retrofit was done and whether there is a permit for it. Then get a quote and run the deductible math on your actual dwelling limit before deciding about insurance.
None of that makes a neighborhood good or bad. What it changes is what you should research before you commit, which is the same thing we would say about school boundaries or a safety score. The maps are public, the retrofit lists are public, and the market is not pricing either of them for you. That is exactly the sort of thing worth knowing about an area before you fall in love with an address.
Sources
- USGS, HayWired earthquake scenario, engineering implications
- SPUR, The HayWired earthquake scenario
- USGS, probability of a major earthquake in the Bay Area
- USGS, San Francisco Bay Area liquefaction hazard maps
- California Geological Survey, EQ Zapp earthquake zones of required investigation
- DataSF, map of soft-story properties
- City of Oakland, mandatory soft story retrofit program
- City of San Jose, soft story retrofit program
- California Department of Insurance, 2025 earthquake premium and policy count data call
- California Earthquake Authority, homeowners policies and deductibles
- California Residential Mitigation Program, Earthquake Brace and Bolt eligibility
- NOAA National Centers for Environmental Information, costliest US tropical cyclones
- CP&DR news briefs, August 4, 2026
- Houseberry city and neighborhood price histories and 2026 neighborhood scores for San Francisco, Oakland and Alameda.
All information provided on this website including but not limited to - school ratings, safety, amenities, user opinions, and property data - is for general informational purposes only. We do not guarantee its reliability, accuracy, or completeness. Users should independently verify information and consult appropriate professionals as needed. By using this website, you agree Houseberry is not responsible for actions, decisions, or consequences arising from reliance on the information provided
houseberry.com - CA DRE# 01847391
 Bay East ©2025. CCAR ©2025. bridgeMLS ©2025. Information Deemed Reliable But Not Guaranteed. This information is being provided by the Bay East MLS, or CCAR MLS, or bridgeMLS. The listings presented here may or may not be listed by the Broker/Agent operating this website. This information is intended for the personal use of consumers and may not be used for any purpose other than to identify prospective properties consumers may be interested in purchasing. Data last updated at September 21, 2026 12:00 AM