Is San Leandro Safe? An Honest 2026 Answer
San Leandro’s 18 neighborhoods score from 4.9 down to 1.7 for safety, and the split runs almost exactly along Interstate 880. Here is the 2026 map and what it costs.
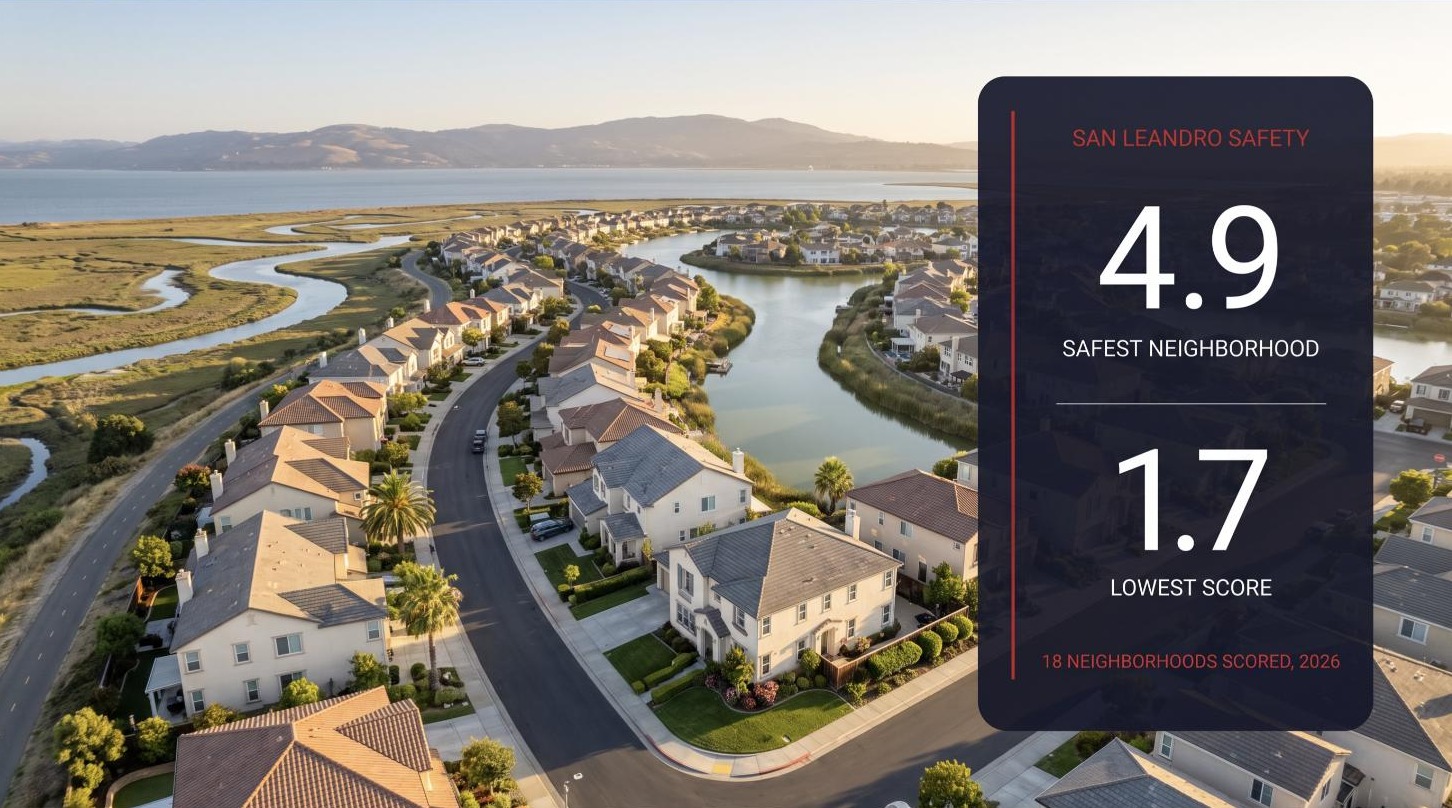
Aerial view of San Leandro’s bayside lagoon neighborhoods with a data panel showing 2026 safety scores ranging from 4.9 in the safest neighborhood to 1.7 in the lowest across 18 scored neighborhoods. Photo: Houseberry
San Leandro is a middling city with two very different halves, and the freeway is the seam. Its 18 scored neighborhoods run from 4.9 out of 5 for safety down to 1.7, the citywide average lands at 3.5, and every one of the five highest scores sits on the bay side of Interstate 880. That is the honest answer, and it is more useful than any yes or no.
For a city of about 90,000 people wedged between Oakland and Hayward, the citywide 3.5 is a respectable number. It beats Oakland’s 3.0 and Hayward’s 3.3 on the same scale, and trails Castro Valley’s 4.7 next door. All 18 neighborhood scores are on Houseberry’s San Leandro safety ranking.
The bay side is the safe side
Five neighborhoods score 4.5 or higher, and they are all the same kind of place: planned communities built west of the freeway on filled bay margin, laid out around lagoons and tidal sloughs with curving streets and few through routes. Bonaire leads the city at 4.9. Heron Bay Marina Vista, Heron Bay Marina Vista South, Marina Faire and Mission Bay Mobile Home Park all read 4.5.
The built form is doing most of the work here, the same way it does in the foothill tracts of San Jose. Streets that loop back on themselves and end at water generate very little of the opportunistic activity that incident data records. It is a real effect rather than a scoring quirk, but it is worth naming, because it means the score is partly measuring a street pattern.
Bonaire is the one to know. A 4.9 safety score at a $783,900 median, which is below the city’s own $842,370 median, makes it the only neighborhood in San Leandro that is both the safest-scoring and cheaper than average. Nothing else in the top five costs under $880,000, and the two Heron Bay entries run past $1.2 million.
Where the scores drop
Only two neighborhoods score below 2.5, and both read 1.7: Aladdin Avenue and Floresta Gardens. Both sit inland, both carry medians in the $840,000 to $890,000 range, which is the awkward part of San Leandro’s market. You are not paying less for the lower score. Aladdin Avenue at $840,000 costs almost exactly the citywide median with a safety score a third of Bonaire’s.
Between those poles the city is genuinely mid-table rather than divided. Eleven of the 18 neighborhoods score between 2.7 and 4.1, a tight band, which is why the citywide average holds at 3.5 despite the two low outliers. San Leandro does not have a large weak zone. It has two pockets.
Downtown is the tradeoff everyone actually faces
Downtown San Leandro scores 3.2 for safety and 4.3 for amenities, the highest amenities score in the city, and it has the BART station. That combination is the real decision for most buyers looking here, and the pattern repeats across the region: the walkable center scores lower on incident data because daytime and evening crowds concentrate reports against a small resident population.
Halcyon and Foothill runs the same shape at a smaller scale, 4.1 for amenities against 2.7 for safety at $771,916. If the reason you are considering San Leandro is that you can reach San Francisco by train without paying San Francisco prices, these are the two neighborhoods that answer that, and both ask you to accept a mid-range safety number.
The column nobody looks at
Schools. San Leandro’s neighborhood school scores average 2.56, and the single highest in the city is 2.8, shared by Heron Bay Marina Vista, Mission Bay Mobile Home Park, Washington Manor and North Area. There is no strong-school pocket to move to. That is the most significant limitation in this city’s data and it does not vary by which side of the freeway you pick.
How San Leandro compares to its neighbors
| Place | Safety | Overall | Median price |
|---|---|---|---|
| Castro Valley | 4.7/5 | 4.0/5 | $1,148,830 |
| San Leandro | 3.5/5 | 3.1/5 | $923,975 |
| Hayward | 3.3/5 | 3.0/5 | $966,706 |
| Oakland | 3.0/5 | 2.5/5 | $974,219 |
| Ashland | 2.4/5 | 2.3/5 | $831,036 |
San Leandro sits second in its own immediate neighborhood and costs less than both Oakland and Hayward while scoring better than both. That is why it turns up on affordability lists, and it earned seventh place on our own ranking of the cheapest Bay Area places that are actually safe. Castro Valley is the local ceiling, and it charges about $225,000 more for it.
What the score cannot tell you
These numbers read reported incidents normalized by population. A neighborhood built around lagoons with 1,500 residents and no through traffic will score high almost by construction, and a downtown with a BART station and a restaurant strip will score lower than its streets feel on a Saturday. The score is a comparison tool between neighborhoods on the same scale, not a prediction about any particular block or any particular night.
Where this is heading
San Leandro’s appreciation figures are positive across almost the whole city, with 16 of 18 neighborhoods showing gains, and the strongest movement is in the middle of the table rather than at the top. North Area and Downtown lead. That is the pattern of a city where buyers priced out of Alameda and Castro Valley are working their way down the list, and it usually pulls the middle band up rather than the extremes.
How we scored it
Houseberry scores 18 San Leandro neighborhoods on a 0 to 5 safety scale built from reported incident data normalized by population, alongside school, amenities, price, value and appreciation scores. Figures are as of August 5, 2026 and update as new data lands. City-level comparisons use Houseberry’s East Bay city scores on the same scale. Alameda County’s own public safety reporting is published by the Alameda County Sheriff’s Office. The live table is on the San Leandro safety ranking.
Quick answers
Is San Leandro a safe city? On Houseberry’s 2026 data San Leandro averages 3.5 out of 5 for safety across 18 neighborhoods, above Oakland at 3.0 and Hayward at 3.3, and below Castro Valley at 4.7. Six of its 18 neighborhoods score 4.0 or higher.
What is the safest neighborhood in San Leandro? Bonaire, at 4.9 out of 5, with a $783,900 median that sits below the citywide figure. Heron Bay Marina Vista, Heron Bay Marina Vista South, Marina Faire and Mission Bay Mobile Home Park follow at 4.5.
Which parts of San Leandro score lowest? Aladdin Avenue and Floresta Gardens, both at 1.7 out of 5. They are the only two neighborhoods in the city scoring below 2.5, and both carry medians close to the citywide average.
Is downtown San Leandro safe? Downtown scores 3.2 for safety and 4.3 for amenities, the highest amenities score in the city. Like most transit and retail centers on this scale, it records more incidents against a smaller resident population than the surrounding residential areas.
Is San Leandro safer than Oakland? On Houseberry’s citywide scores, yes: 3.5 against 3.0. Both cities vary far more inside their own boundaries than they do against each other, so compare specific neighborhoods rather than the city averages.
Looking at a specific street? Open the San Leandro rankings and click any neighborhood for its full scorecard.
Map of San Leandro Neighborhoods
Loading map...
View Full Map
Top Neighborhoods in San Leandro, CA



All information provided on this website including but not limited to - school ratings, safety, amenities, user opinions, and property data - is for general informational purposes only. We do not guarantee its reliability, accuracy, or completeness. Users should independently verify information and consult appropriate professionals as needed. By using this website, you agree Houseberry is not responsible for actions, decisions, or consequences arising from reliance on the information provided
houseberry.com - CA DRE# 01847391
 Bay East ©2025. CCAR ©2025. bridgeMLS ©2025. Information Deemed Reliable But Not Guaranteed. This information is being provided by the Bay East MLS, or CCAR MLS, or bridgeMLS. The listings presented here may or may not be listed by the Broker/Agent operating this website. This information is intended for the personal use of consumers and may not be used for any purpose other than to identify prospective properties consumers may be interested in purchasing. Data last updated at September 18, 2026 12:00 AM