San Francisco School Closures: Which Neighborhoods Are Exposed
San Francisco Unified has about 14,000 empty seats and no closure list on the table. Here is how to read closure exposure by neighborhood, with school scores and current median prices.
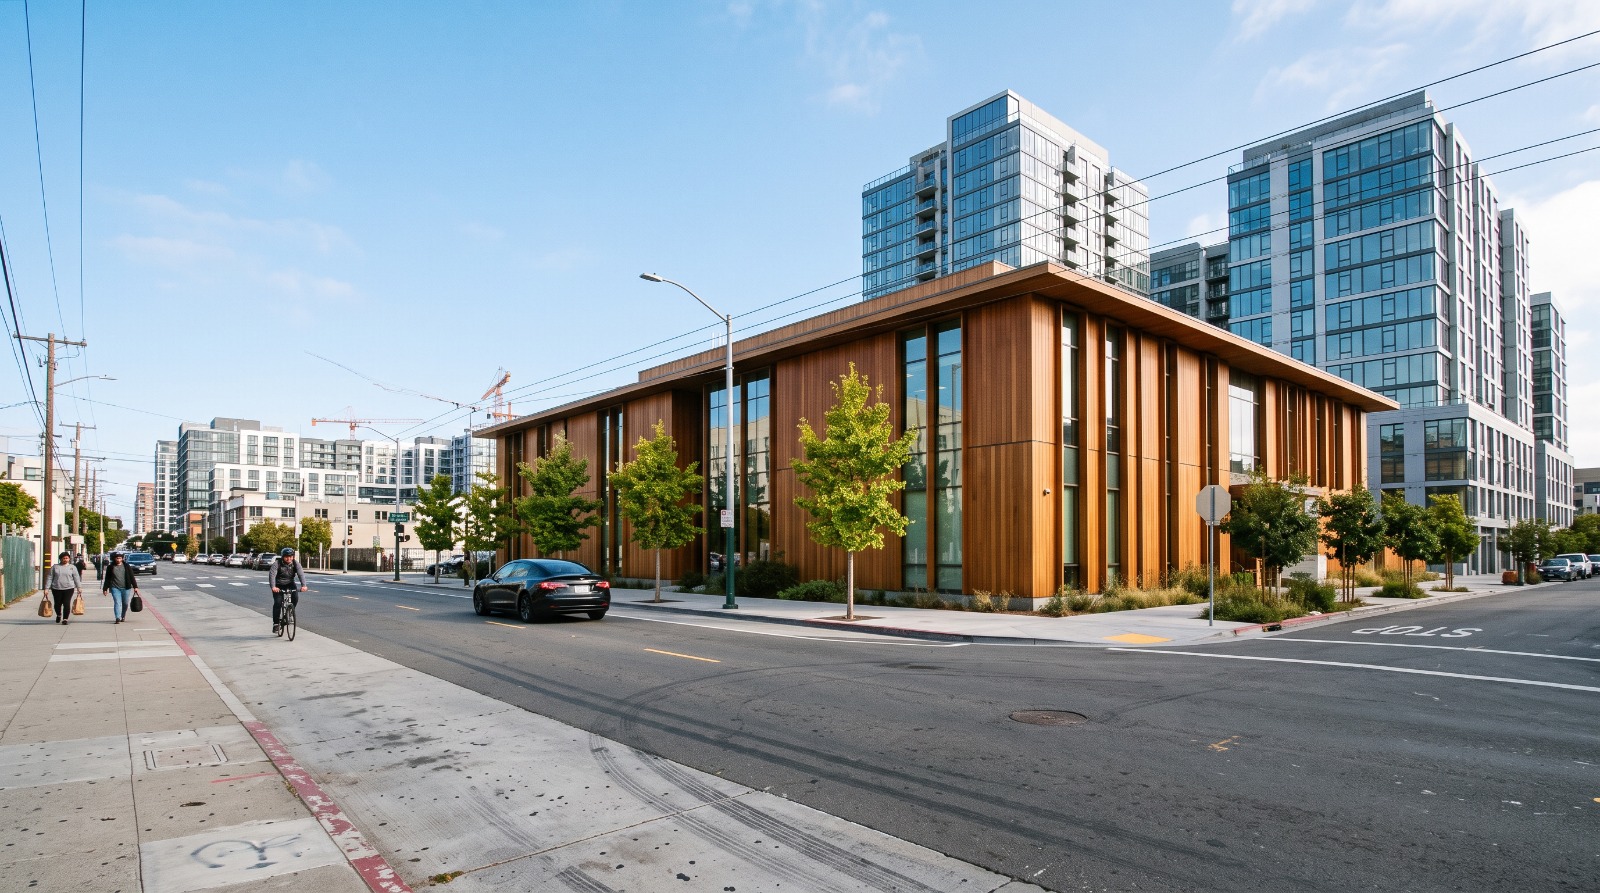
Owens Street in Mission Bay, San Francisco, where the city opened its first new public elementary school in more than a decade in August 2026. Photo: Houseberry
On August 17 a few dozen four- and five-year-olds walk into a brand new $95.4 million school on Owens Street in Mission Bay, the first campus San Francisco Unified has opened in more than a decade. The district that built it is sitting on roughly 14,000 empty seats across about 125 campuses and expects to lose another 4,600 students by 2032.
The thing to know if you are choosing where to live: there is no closure list right now. The 13-school list SFUSD published in October 2024 was scrapped, the superintendent who wrote it resigned, and the closure date has moved four times since. What does exist is exposure, and exposure is readable. It sits in the neighborhoods where enrollment already collapsed, and in San Francisco those are almost exactly the neighborhoods that already score lowest for schools.
So the honest answer to “which schools are closing” is nobody knows, including the school board. The useful answer is a different question, and it is one you can actually research before you make an offer.
No list, four delays, and a date that keeps moving
Nothing has been decided. The last time San Francisco came close, SFUSD named 13 schools for closure or merger on October 8, 2024, facing a $400 million shortfall over three years. The board vote scheduled for that December never happened. Superintendent Matt Wayne resigned, Maria Su took over, and the process stopped.
It restarted in November 2025, when the board introduced a Strong Schools Resolution directing Su to bring back a reorganization proposal by August 2026, with changes landing before the 2027-28 school year. By January 2026 the reporting had it down to three sites and a $51 million deficit. Then in May the district quietly pushed closures to no earlier than 2029-30, and board members found out by reading the newspaper. Board President Phil Kim, in that same coverage: “I don’t really have clarity on exactly what’s happening.”
The district’s own Resource Alignment Initiative page has not been meaningfully updated since November 2024 and still describes a timeline that expired. February 2026 brought the first teachers’ strike in roughly 50 years, which closed every school in the district for a week and pushed everything else back again. If you are trying to time a home purchase around a closure announcement, that is the record you are betting against.
The seats emptied because the children are not being born here
San Francisco Unified enrolled about 55,000 students in late 2025, down from roughly 61,000 before the pandemic, which puts it back near its 2009 enrollment. That is nearly 6,000 students gone since 2019-20, and the district now teaches about 65 percent of the city’s school-age children.
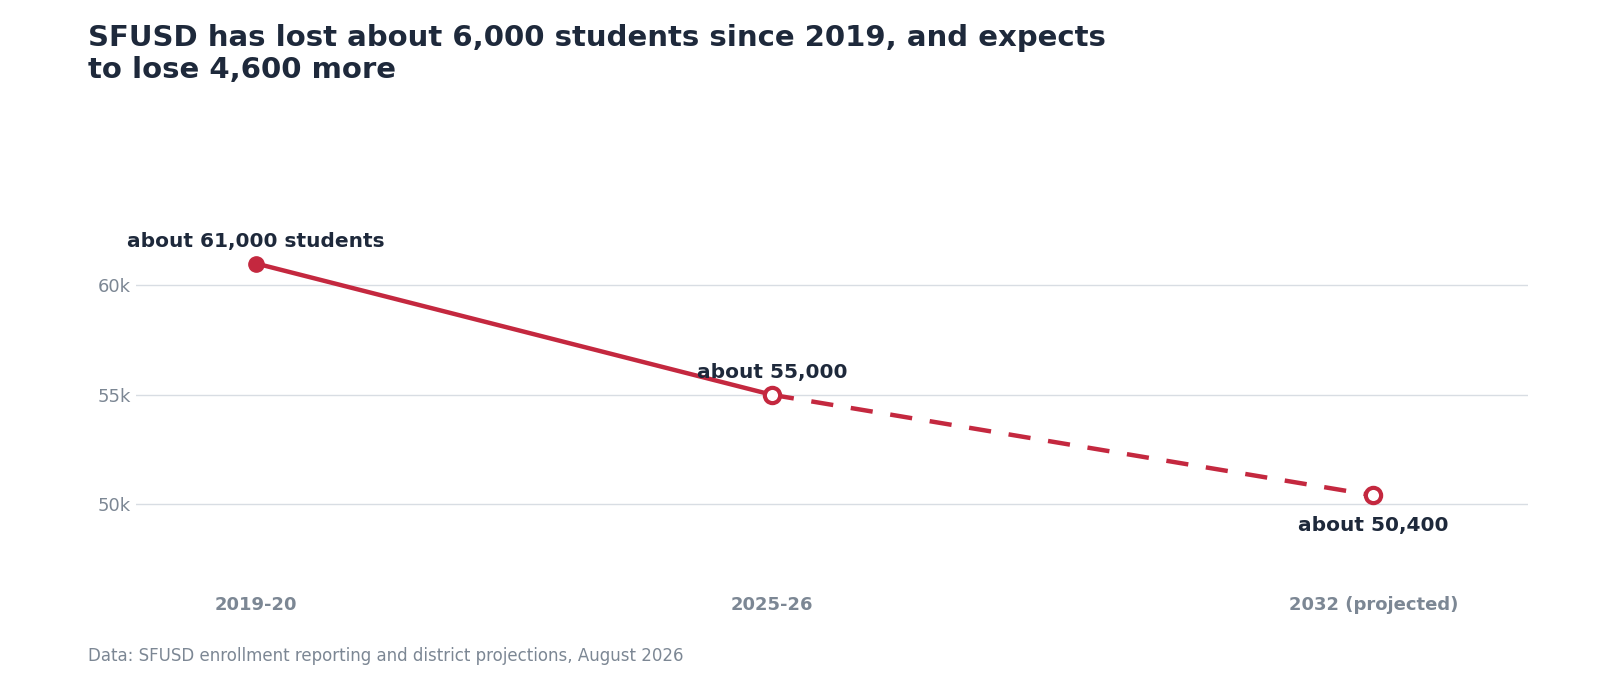
The empty-seat count is projected to grow from roughly 14,000 today to nearly 19,000 by 2032. None of that is a mystery. San Francisco recorded 39 births per 1,000 women in 2021, the lowest rate among California’s large counties and well under Los Angeles at 47. Fewer babies in 2021 means fewer kindergarteners in 2026 and fewer fifth graders in 2032. Housing costs and remote work moved families out, and the ones who stayed had fewer kids.
Here is the part that gets skipped in the outrage cycle. Closing a school genuinely saves money, roughly $1 million a year per campus by the district’s own 2024 estimate. Half-empty buildings absorb custodial budgets, principal salaries and deferred maintenance that could otherwise go to teachers. A district running a $51 million deficit and shrinking every year cannot keep 125 campuses open forever. The case for closures is not villainous. It is arithmetic. The fight is about which ones, and that is where geography starts to matter.
Closures land where the school scores were already lowest
Every school that showed up on the 2024 list, and every school in the December 2025 enrollment analysis that followed it, sits in the bottom quartile of our school rankings. The pattern is not subtle.
| School (neighborhood) | 2024-25 enrollment | Change from peak |
|---|---|---|
| George Washington Carver (Bayview) | 93 | down 67% from 282 in 2009-10 |
| El Dorado (Visitacion Valley) | 128 | down 58% from 308 in 2012-13 |
| Visitacion Valley Elementary | 239 | down 49% from 469 in 2012-13 |
| Harvey Milk Civil Rights Academy | 137 | down 46% since 2012-13 |
Those are SF Standard’s numbers from district data, published December 1, 2025. Five SFUSD schools have lost more than half their enrollment since their late-2000s peaks. A school with 93 children in a building sized for 300 is not a school with a scheduling problem. It is a school with a closure conversation attached to it.
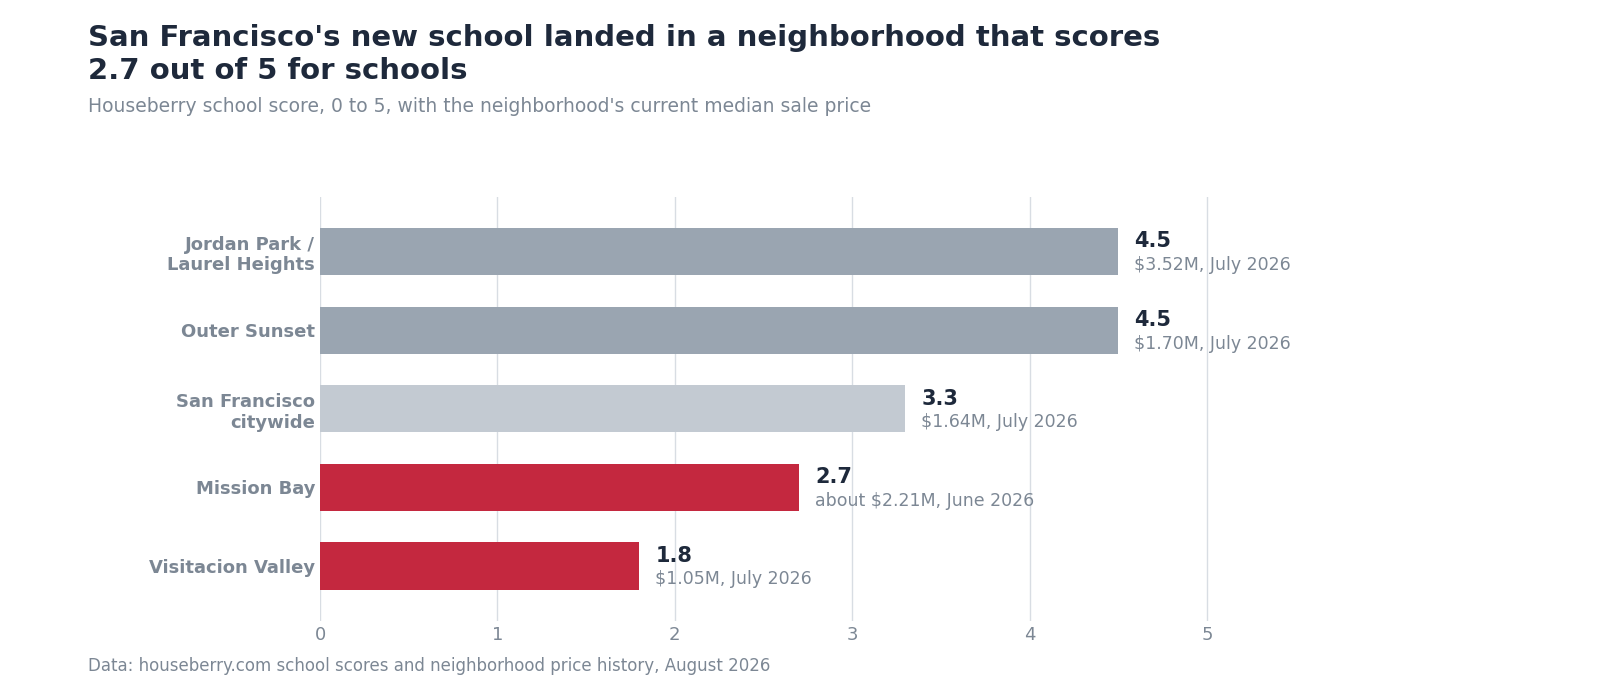
Now overlay the map. South of Market, Visitacion Valley, the Inner Mission, the Excelsior, Portola, Bayview and Hunters Point all score between 1.4 and 2.5 out of 5 for schools on our ranking of all 92 San Francisco neighborhoods, against a citywide 3.3. The top of that same ranking is essentially the Richmond and the Sunset. Jordan Park and Laurel Heights at 4.5, Outer Sunset at 4.5, Lone Mountain and North Panhandle and Anza Vista at 4.4, Presidio Heights and Inner Richmond at 4.3. Seven of the top eight are west-side or north-west neighborhoods, and almost none of them were touched by the 2024 list. Sutro, in the Richmond, was the exception that made the pattern obvious.
So closures do not fall randomly across the city. They fall on the neighborhoods that already score lowest, and they fall on them a second time. A family in Visitacion Valley, where the median was $1.05 million in July 2026, has already lost two schools from one list. A family in the Outer Sunset has lost nothing and has waitlists.
Mission Bay is the strange one
The city just spent $95.4 million building a school in a neighborhood that scores 2.7 out of 5 for schools, 68th of 92, and closed nothing in the neighborhoods that score 4.5.
That is less crazy than it sounds. Mission Bay is the neighborhood adding children fastest, it shares the Daniel Webster attendance area, which SFUSD calls its most populous and rapidly growing, and the school was funded by a 2016 bond, not by this year’s budget. You do not close and build with the same dollars. But the timing tells you something real about how slowly school capacity follows housing. Mission Bay has been under construction since the late 1990s and is getting its first campus in 2026.
If you are buying in Mission Bay for the school, buy carefully. It opens with pre-K, TK and kindergarten only, plus one combined special-education class, and grows a grade a year. It does not reach full TK-5 with preschool until 2032, the same year the district projects its enrollment trough. A family with a second-grader is not enrolling there this fall. Middle school feeds to Everett and Francisco. The neighborhood’s median ran about $2.21 million in June 2026, though sales volume there is thin enough that I would treat that figure as a rough marker rather than a trend.
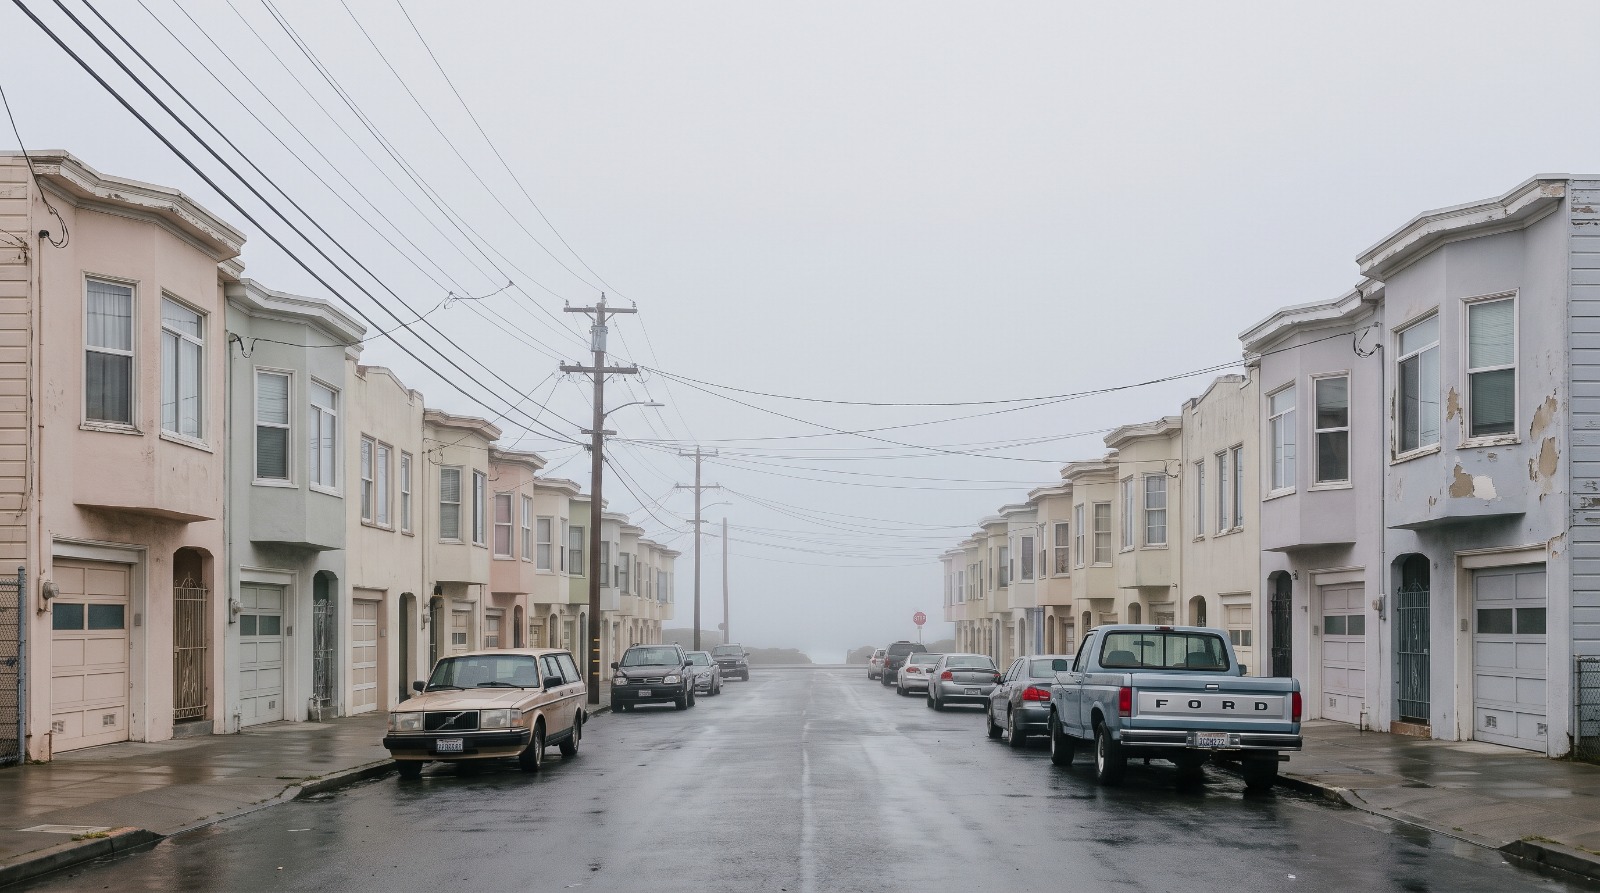
Compare that with the Outer Sunset, second in the city for schools at 4.5, where the July 2026 median was $1.70 million against a citywide median of $1.64 million. You are paying roughly the city average for the second-best school score in San Francisco. Jordan Park and Laurel Heights, tied at the top, went from $2.59 million in August 2025 to $3.52 million in July 2026, which is what happens when a school score is genuinely priced in. The Sunset has not fully repriced yet. That is the arbitrage, and it is the fog tax.
How I would read this if I were house-hunting this fall
Stop asking whether a specific school will close. Nobody can answer that, and the two most recent official answers contradicted each other by two years. Ask about enrollment trajectory instead, because that is the variable the district actually uses and the one you can look up.
A neighborhood with a low school score and a falling child population is where a closure eventually lands. A neighborhood with a high school score and long waitlists is structurally protected, and that protection is already showing up in the price. The way we look at neighborhoods, a school score is not a verdict on the children in a building. It is a signal about demand, and demand is what keeps a campus open.
Two more things worth knowing. The enrollment lottery overhaul, which was supposed to move San Francisco toward zone-based assignment, has slipped to 2028-29, and closures are sequenced behind it. That is the real reason the closure date keeps sliding. And if you are worried a closure would crater your home value, there is no good evidence of that at the neighborhood level in San Francisco. What moves is the attendance-area reputation over years, not the week the board votes. Visitacion Valley did not reprice when El Dorado shrank by 58 percent. It repriced slowly, for a decade, for a dozen reasons.
The uncomfortable version of all this: San Francisco is going to close schools in the neighborhoods that can least afford to lose them, because that is where the children went missing first. Knowing that before you buy is not the same as being able to fix it. But it does mean the school score and the enrollment trend belong next to the price on your spreadsheet, not after it.
Sources
- The San Francisco Standard, “SF plans to close schools — but Mission Bay just got a new one,” August 6, 2026
- SFUSD, “SFUSD Opening New Elementary School in One of the City’s Fastest-Growing Neighborhoods,” October 2, 2025
- The San Francisco Standard, per-school enrollment analysis, December 1, 2025
- The San Francisco Standard, “SF school board blindsided by new district plan on closures,” May 8, 2026
- The San Francisco Standard, on the enrollment-system overhaul timeline, May 18, 2026
- The San Francisco Standard, the October 8, 2024 closure list
- SFUSD, Resource Alignment Initiative
- GrowSF, “SFUSD prepares for major school reorganization,” December 3, 2025
- Kidsdata, California Department of Public Health birth-rate data by county
- Houseberry, best neighborhoods for schools in San Francisco
- Houseberry, San Francisco city guide and price history
All information provided on this website including but not limited to - school ratings, safety, amenities, user opinions, and property data - is for general informational purposes only. We do not guarantee its reliability, accuracy, or completeness. Users should independently verify information and consult appropriate professionals as needed. By using this website, you agree Houseberry is not responsible for actions, decisions, or consequences arising from reliance on the information provided
houseberry.com - CA DRE# 01847391
 Bay East ©2025. CCAR ©2025. bridgeMLS ©2025. Information Deemed Reliable But Not Guaranteed. This information is being provided by the Bay East MLS, or CCAR MLS, or bridgeMLS. The listings presented here may or may not be listed by the Broker/Agent operating this website. This information is intended for the personal use of consumers and may not be used for any purpose other than to identify prospective properties consumers may be interested in purchasing. Data last updated at September 25, 2026 12:00 AM