Where Silicon Valley Actually Built Homes in 2025
Santa Clara led Silicon Valley in home production in 2025 and San Jose came second. But per resident the gap is almost nine to one, and the building leader is not the city adding the most future supply. The numbers, read properly.

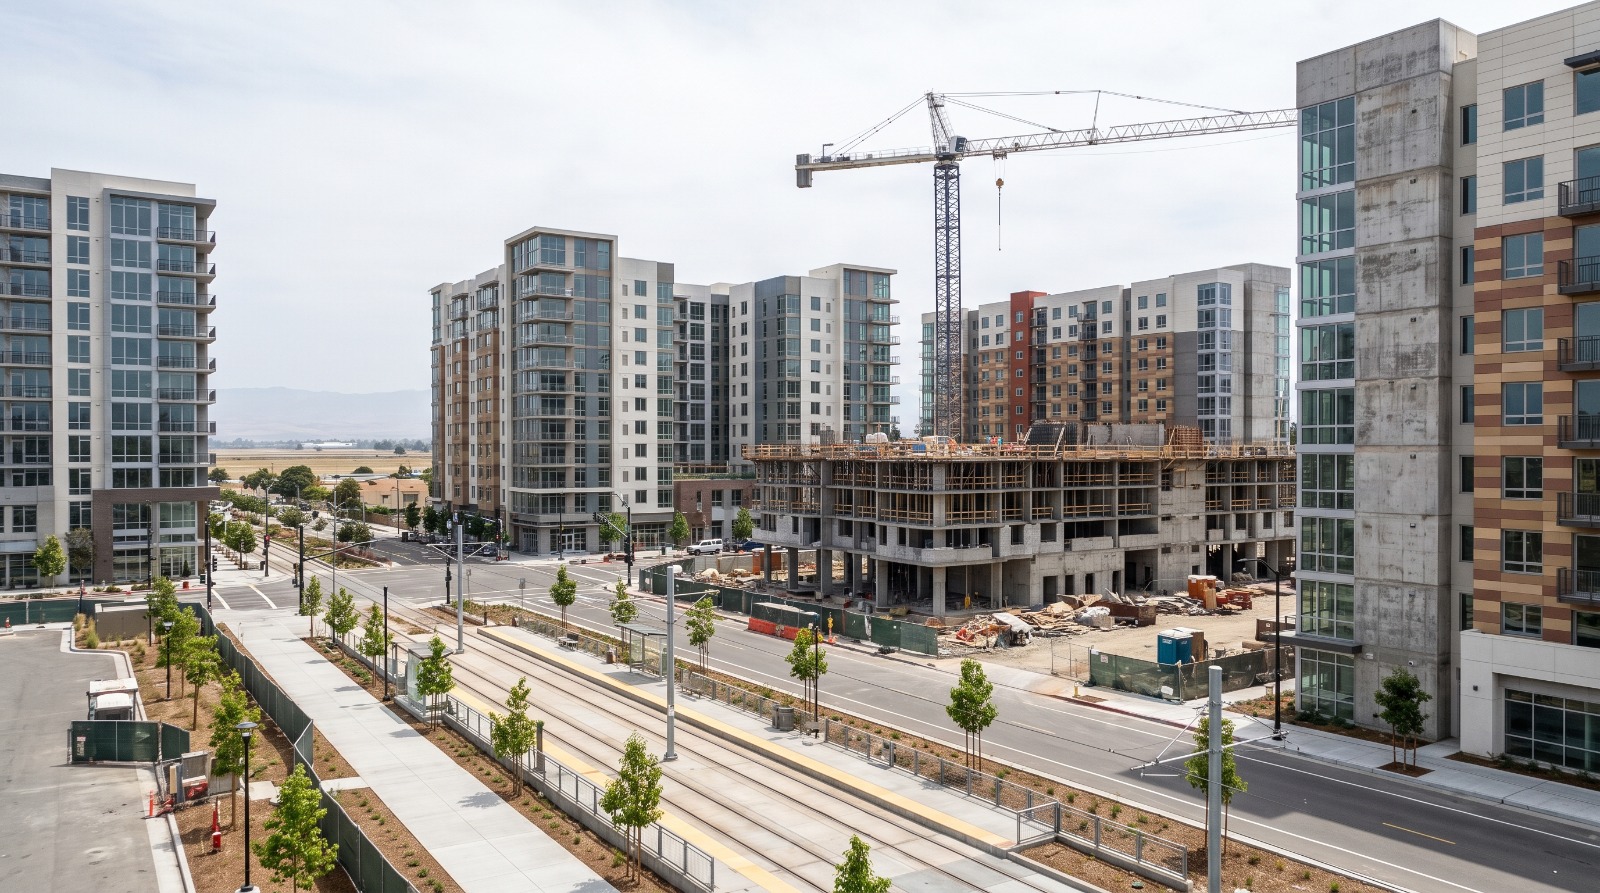
New apartment towers rising near Levi's Stadium in Santa Clara, the center of Silicon Valley's 2025 housing production. Photo: Houseberry
Santa Clara, a city of about 135,000 people, finished more new homes in 2025 than San Jose, a city of nearly a million. That is the headline from the latest Silicon Valley housing production data, and on its own it reads like a fun trivia fact. Look one layer down and it is the whole story of how the South Bay builds, where the homes go, and why a record year and cheaper housing are not the same sentence.
Santa Clara logged about 2,685 completed units in 2025. San Jose came second at 2,192. The region cleared 9,000 for the year. Those numbers are real, and worth celebrating. They are also easy to misread, so here is what they actually say.
The per-resident gap is almost nine to one
Raw totals reward size, and San Jose is enormous, so second place flatters it. Put production on a per-resident basis and the ranking scrambles.
| City | 2025 homes added | Population | Per 1,000 residents | State target 2023-31 |
|---|---|---|---|---|
| Santa Clara | 2,685 | 134,587 | ~20 | 11,632 |
| San Jose | 2,192 | 979,415 | ~2.2 | 62,200 |
| Sunnyvale | ~540* | 159,673 | ~3.4 | 11,966 |
| Mountain View | ~388* | 86,513 | ~4.5 | 11,135 |
One caveat, because honesty matters with a table like this. Santa Clara and San Jose are 2025 completions, homes that actually finished. The Sunnyvale and Mountain View figures marked with an asterisk are permit-based and shown only for scale. Populations are California Department of Finance estimates for January 2025.
Even with that caveat, the reveal holds. Santa Clara added roughly 20 homes for every 1,000 residents last year. San Jose added about 2.2. That is close to a nine-to-one gap on the two cleanest, apples-to-apples numbers in the set. On the metric that tracks whether a city is pulling its weight, San Jose sits near the bottom of the South Bay, not in a close second. Its big raw number is a population illusion. You can see the underlying places on how San Jose's neighborhoods rank, but the citywide production number is thinner than it looks.
Santa Clara is cashing a check it wrote years ago
Here is the twist the leaderboard hides. Santa Clara's 2,685 completions in 2025 are actually more than the total number of homes it has permitted so far this entire housing cycle. The city is finishing a wave of towers approved years ago near Levi's Stadium, while its pace of new permits, the pipeline for 2027 and 2028, is running only about half of what the state target requires.
The city quietly building the most future supply is Mountain View, which has pulled about 3,497 permits and is 31 percent of the way to its target, the closest of any big South Bay city. So who finished the most homes in 2025 and who will be finishing the most in 2028 are probably two different cities. If you want to guess where the cranes will still be standing in a few years, follow the permits, not the ribbon cuttings.
Almost all of it is apartments by the stadium
Santa Clara's production is not scattered houses. It is dense, transit-oriented rental apartments packed into a former industrial belt off Tasman Drive by Levi's Stadium, in what the city now calls the Clara District, with roughly 2,000 units under construction there as of last spring. Add Gateway Crossings, whose first phase opened 725 apartments in September 2025, and the record mostly comes down to a handful of big projects finishing at once.
The marquee megaproject is not even part of it. Related's CityPlace, a 1,680-home plan, has sat in limbo since 2015, delayed by litigation and financing. The homes that opened are the ones nobody put on a billboard.
A record year is still underbuilding
Zoom out and even the leaders are behind. Santa Clara County is about 40 percent of the way through its 2023 to 2031 state housing cycle, and not one of its cities has permitted 40 percent of its target. The celebrated 9,000-unit year is roughly 60 percent of the annual pace the county is supposed to hit. This was a good year by recent standards and still short of the assignment. Worth remembering the next time a record production headline implies the shortage is solving itself.
What all this building did to prices
Now the question every buyer and renter actually cares about. Did building more make anything cheaper? The answer is a clean lesson in what supply does and does not do.
On rents, the pattern holds. The two heaviest-building markets have the softest rents. San Jose's median rent is essentially flat year over year, and Santa Clara's is up only about 3.5 percent. Meanwhile Sunnyvale, which permitted a fraction of its target, has seen rents climb around 10 percent amid an office boom and thin new supply. Build apartments, and apartment rents cool. That is supply working, in the product type it adds. You can see where Sunnyvale's neighborhoods land if you are weighing the trade.
On for-sale prices, it barely registered. Santa Clara's median sale price still ran up about 14 percent over the past year, because the new supply is apartments and condos, not the detached houses that set the median. Cutting rents and cutting home prices are different problems, and 2025 only moved one of them.
So what does it mean if you are choosing a South Bay neighborhood right now? If you rent, or you are buying a first condo, the new supply is genuinely on your side, and it is concentrated in a walkable, transit-served pocket of Santa Clara that barely existed a decade ago. You can see how those areas score on Santa Clara's neighborhood rankings and where the best value sits today. If you are hunting a detached home, none of this year's building was really aimed at you, and you will feel that in the price. That gap, between what got built and what you are trying to buy, is the thing to check before you fall for a lots-of-new-construction pitch. When we compare neighborhoods, the type of what is being built matters as much as the count.
One more honest note. Very little of 2025's production was affordable in the deed-restricted sense. Countywide, only around 600 newly opened units were below market, on the order of 7 percent of the total. The record year was overwhelmingly market-rate. That is not a scandal, it is just what the financing produces right now, and it is why the affordability story leans on the rent softening more than on the price tags.
Quick questions on South Bay building
Which South Bay city built the most homes in 2025?
Santa Clara, with about 2,685 completed units, just ahead of San Jose at 2,192. But Santa Clara is far smaller, so per resident it out-built San Jose by nearly nine to one.
Does more building mean lower prices?
It lowered rents more than sale prices. Heavy-building San Jose and Santa Clara saw flat-to-slow rent growth, while thin-building Sunnyvale saw rents jump. Detached-home prices kept rising, because the new supply was apartments, not houses.
Where in Santa Clara are the new homes?
Almost all of them are apartments in the Clara District and Gateway Crossings, near Levi's Stadium and the Tasman light-rail corridor, not spread across existing single-family neighborhoods.
Is Silicon Valley catching up on its housing goals?
Not yet. No Santa Clara County city has permitted even 40 percent of its 2023 to 2031 state target at the cycle's roughly 40 percent mark. A record year still fell short of the pace.
Sources
- Santa Clara News Online: Santa Clara leads Silicon Valley in 2025 housing production
- Urban Insight Group: Bay Area RHNA tracker
- California Department of Finance: E-1 population estimates, January 2025
- SF YIMBY: Gateway Crossings opens first phase in Santa Clara
- San Jose Spotlight: Related Santa Clara still in limbo
- SF Standard: Sunnyvale's real estate boom
- SV@Home: Affordable housing milestones in 2025
The Houseberry Research Team is Houseberry's reporting team: Bay Area real estate analysts, data specialists and longtime local market watchers. Every day we check the public record: building permits, city council and planning agendas, county recorder filings, state housing bills, police incident data and school results. Then we tie each story to what it means for specific neighborhoods, using Houseberry's own neighborhood data on prices, appreciation, safety, schools and amenities. Questions or corrections: Contact us.
All information provided on this website including but not limited to - school ratings, safety, amenities, user opinions, and property data - is for general informational purposes only. We do not guarantee its reliability, accuracy, or completeness. Users should independently verify information and consult appropriate professionals as needed. By using this website, you agree Houseberry is not responsible for actions, decisions, or consequences arising from reliance on the information provided
houseberry.com - CA DRE# 01847391
 Bay East ©2025. CCAR ©2025. bridgeMLS ©2025. Information Deemed Reliable But Not Guaranteed. This information is being provided by the Bay East MLS, or CCAR MLS, or bridgeMLS. The listings presented here may or may not be listed by the Broker/Agent operating this website. This information is intended for the personal use of consumers and may not be used for any purpose other than to identify prospective properties consumers may be interested in purchasing. Data last updated at October 23, 2026 12:00 AM