Best Neighborhoods in Hayward, CA: The 2026 Data
Thirteen of Hayward’s 20 neighborhoods show falling prices, and the city’s three highest safety scores all sell under $900,000. The 2026 ranking, with the numbers behind it.
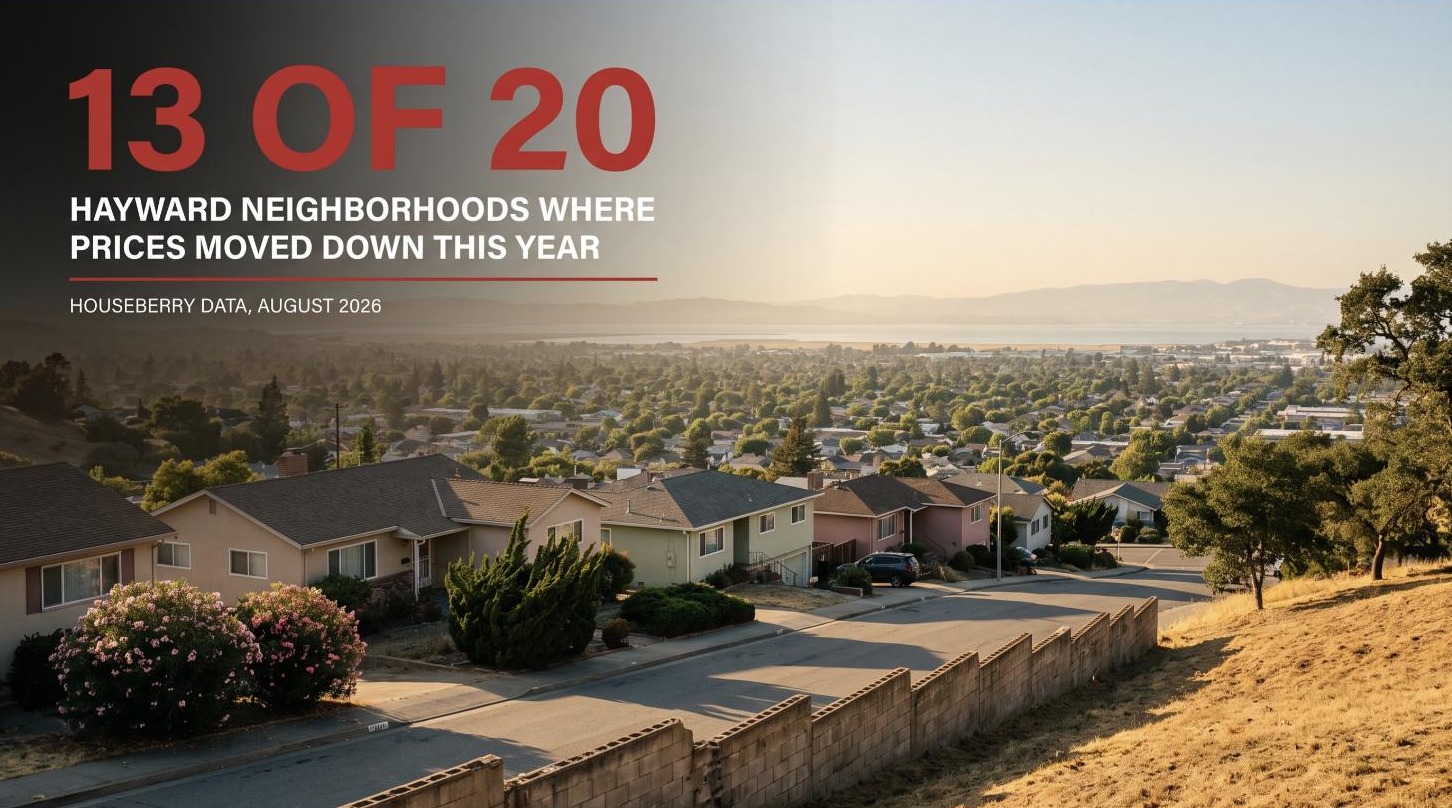
Hillside view over Hayward toward San Francisco Bay with a statistic reading 13 of 20 Hayward neighborhoods where prices moved down, from Houseberry’s August 2026 data. Photo: Houseberry
Fairview is the highest-scoring neighborhood in Hayward at 3.8 out of 5 overall, built on a 4.7 safety score, and it costs $877,872. That is the short answer. The longer one is more interesting, because Hayward is doing something almost no other Bay Area city is doing right now: 13 of its 20 neighborhoods show falling prices, with an average move of roughly negative 5.6 percent.
Below is the ranked list from Houseberry’s Hayward neighborhood rankings, all 20 scored as of August 5, 2026, with the price direction attached to each. If you are here because you are weighing Hayward as a place to buy rather than just to live, that last column is the one to read.
The top ten by overall score
| # | Neighborhood | Overall | Safety | Schools | Median price | Price move |
|---|---|---|---|---|---|---|
| 1 | Fairview | 3.8/5 | 4.7/5 | 3.2/5 | $877,872 | -19.8% |
| 2 | Hayward Highland | 3.5/5 | 3.8/5 | 3.1/5 | $1,246,680 | -3.3% |
| 3 | Fairway Park | 3.5/5 | 4.6/5 | 2.2/5 | $895,238 | -7.1% |
| 4 | Burbank | 3.4/5 | 4.4/5 | 2.4/5 | $733,041 | -15.1% |
| 5 | Cherryland | 3.3/5 | 4.4/5 | 2.2/5 | $716,189 | -1.3% |
| 6 | Glen Eden | 3.3/5 | 3.6/5 | 2.9/5 | $875,021 | -5.7% |
| 7 | Santa Clara | 3.3/5 | 4.0/5 | 2.4/5 | $856,333 | -7.8% |
| 8 | Whitman-Mocine | 3.1/5 | 4.6/5 | 1.7/5 | $789,001 | +4.6% |
| 9 | Harder-Tennyson | 3.1/5 | 4.2/5 | 2.0/5 | $820,836 | +0.9% |
| 10 | Tennyson-Alquire | 3.0/5 | 3.8/5 | 2.1/5 | $796,976 | -2.3% |
Fairview is the clear leader, and it is falling fastest
Fairview takes the top spot on the strength of a 4.7 safety score, the highest in Hayward, paired with a 3.2 for schools, which is also the highest of any neighborhood outside Carpenter. It sits in the unincorporated hills above the city, larger lots, winding roads, a genuinely different built form from the flatlands. It also carries the steepest price decline in the city at roughly 20 percent. Hill neighborhoods trade thinly, so read that as volatility rather than a verdict, but it is the largest single move in this dataset.
Three strong safety scores under $900,000
This is where Hayward earns its place on a shortlist. Cherryland at $716,189 scores 4.4 for safety. Burbank at $733,041 also scores 4.4. Whitman-Mocine at $789,001 scores 4.6. All three sell below the citywide median of $816,234, and all three score above the Bay Area city average of 3.48 for safety.
Cherryland is the most interesting of the three. Its price barely moved, down 1.3 percent against a citywide average decline of 5.6 percent, which in a soft market is its own signal. Burbank fell 15.1 percent over the same period at a similar price and a matching safety score. Same city, same tier, very different momentum.
The bill for all three arrives in the school column: 2.2, 2.4 and 1.7 respectively. Whitman-Mocine’s 1.7 is the lowest school score in Hayward, and it sits directly beside the city’s second highest safety score. That inversion runs through this whole ranking.
The schools problem is citywide, not local
Hayward’s neighborhood school scores average 2.55, and only one neighborhood in the city clears 3.5: Carpenter at 3.6. Carpenter is also the most expensive neighborhood in Hayward at $1,347,000 and carries a 1.3 amenities score, the lowest on the board, alongside a 2.3 for safety. There is no neighborhood in this city that pairs a strong school score with a strong safety score, and pretending otherwise would be the easiest way to write a dishonest version of this article.
For comparison, Hayward’s East Bay neighbors do better on that pairing. Castro Valley scores 3.6 for schools citywide with a 4.7 for safety, and Fremont scores 4.5 and 3.7. Both cost considerably more, which is precisely the trade Hayward represents. The wider regional picture is in our guide to moving to the Bay Area.
Downtown Hayward is the cheapest entry and the clearest tradeoff
Downtown Hayward is the least expensive neighborhood in the city at $635,000 and posts the highest amenities score at 4.0, with BART, the Cinema Place blocks and a real restaurant strip inside its boundary. It scores 1.9 for safety, tied for the lowest in Hayward with Hayward North and Longwood-Winton Grove. That is the sharpest price-for-score exchange available here, and it is a real option rather than a warning, provided you know which number you are buying.
What the falling prices actually mean
Thirteen of 20 neighborhoods down, seven up, an average of negative 5.6 percent. Three things are worth separating out. The steepest declines cluster in the higher-priced hill and edge neighborhoods, South Gate at negative 27.4 percent, Fairview at negative 19.8, Mission-Garin at negative 17.3, Mission Foothills at negative 17.1, which is where thin transaction counts do the most damage to a median. The flatland neighborhoods moved far less in either direction. And the neighborhoods that gained, Whitman-Mocine, Harder-Tennyson, Upper B Street, Downtown, Hayward North, Carpenter and Longwood-Winton Grove, all sit at or below the citywide median price.
The honest reading is that Hayward’s cheaper flatlands held while its more expensive edges gave ground, on volumes small enough that a single quarter could reverse several of these figures. A median is not an index.
How this compares to the rest of the East Bay
Hayward’s citywide scores read 3.0 overall, 3.3 for safety, 2.5 for schools, at a $966,706 median, which puts it below San Leandro at 3.1 overall and well below Castro Valley at 4.0. It scores above Oakland at 2.5 and Ashland at 2.3. That places Hayward exactly where its price does, in the middle of the inner East Bay, and its neighborhood spread of 4.7 down to 1.9 for safety is wider than San Leandro’s and narrower than Oakland’s. We looked at the neighbor directly north in the San Leandro safety breakdown.
How we ranked this
Houseberry scores 20 Hayward neighborhoods on a 0 to 5 scale across overall, schools, safety, amenities, price, value and appreciation. This list ranks by overall score as of August 5, 2026, with price movement shown from the same pull. Safety scores read reported incidents normalized by population, so transit and retail districts score lower than their streets may feel. Price movement figures come from Houseberry’s appreciation field and reflect small transaction counts in several boundaries, noted above where the effect is largest. Countywide context is published by Alameda County. The live sortable table is on the Hayward neighborhood rankings.
Questions people ask
What is the best neighborhood in Hayward? Fairview, at 3.8 out of 5 overall, with the city’s highest safety score of 4.7 and a 3.2 for schools, at a $877,872 median. Hayward Highland and Fairway Park follow at 3.5.
What are the safest neighborhoods in Hayward? Fairview at 4.7, then Fairway Park and Whitman-Mocine at 4.6, then Burbank and Cherryland at 4.4. Seven of the city’s 20 neighborhoods score 4.0 or higher.
Is Hayward a good place to buy in 2026? The data shows 13 of 20 neighborhoods with falling prices and an average move of negative 5.6 percent, concentrated in the higher-priced hill neighborhoods. Cherryland and Whitman-Mocine held or gained while scoring 4.4 and 4.6 for safety. This is information rather than advice, and small transaction counts make several of these figures volatile.
What is the cheapest neighborhood in Hayward? Downtown Hayward at $635,000, which also carries the city’s highest amenities score at 4.0 and its joint lowest safety score at 1.9.
Does Hayward have good schools? Hayward’s neighborhood school scores average 2.55 and only Carpenter clears 3.5, at 3.6. No Hayward neighborhood pairs a strong school score with a strong safety score in the current data.
Comparing Hayward against its neighbors? Open the Hayward rankings and re-sort by the factor that decides it for you.
All information provided on this website including but not limited to - school ratings, safety, amenities, user opinions, and property data - is for general informational purposes only. We do not guarantee its reliability, accuracy, or completeness. Users should independently verify information and consult appropriate professionals as needed. By using this website, you agree Houseberry is not responsible for actions, decisions, or consequences arising from reliance on the information provided
houseberry.com - CA DRE# 01847391
 Bay East ©2025. CCAR ©2025. bridgeMLS ©2025. Information Deemed Reliable But Not Guaranteed. This information is being provided by the Bay East MLS, or CCAR MLS, or bridgeMLS. The listings presented here may or may not be listed by the Broker/Agent operating this website. This information is intended for the personal use of consumers and may not be used for any purpose other than to identify prospective properties consumers may be interested in purchasing. Data last updated at September 18, 2026 12:00 AM