San Francisco AI Office Boom: What It Means for Neighborhoods
AI tenants now fill roughly a tenth of San Francisco's office space. The boom landed on two very different kinds of block, and the split matters more to a homebuyer than the headline does.
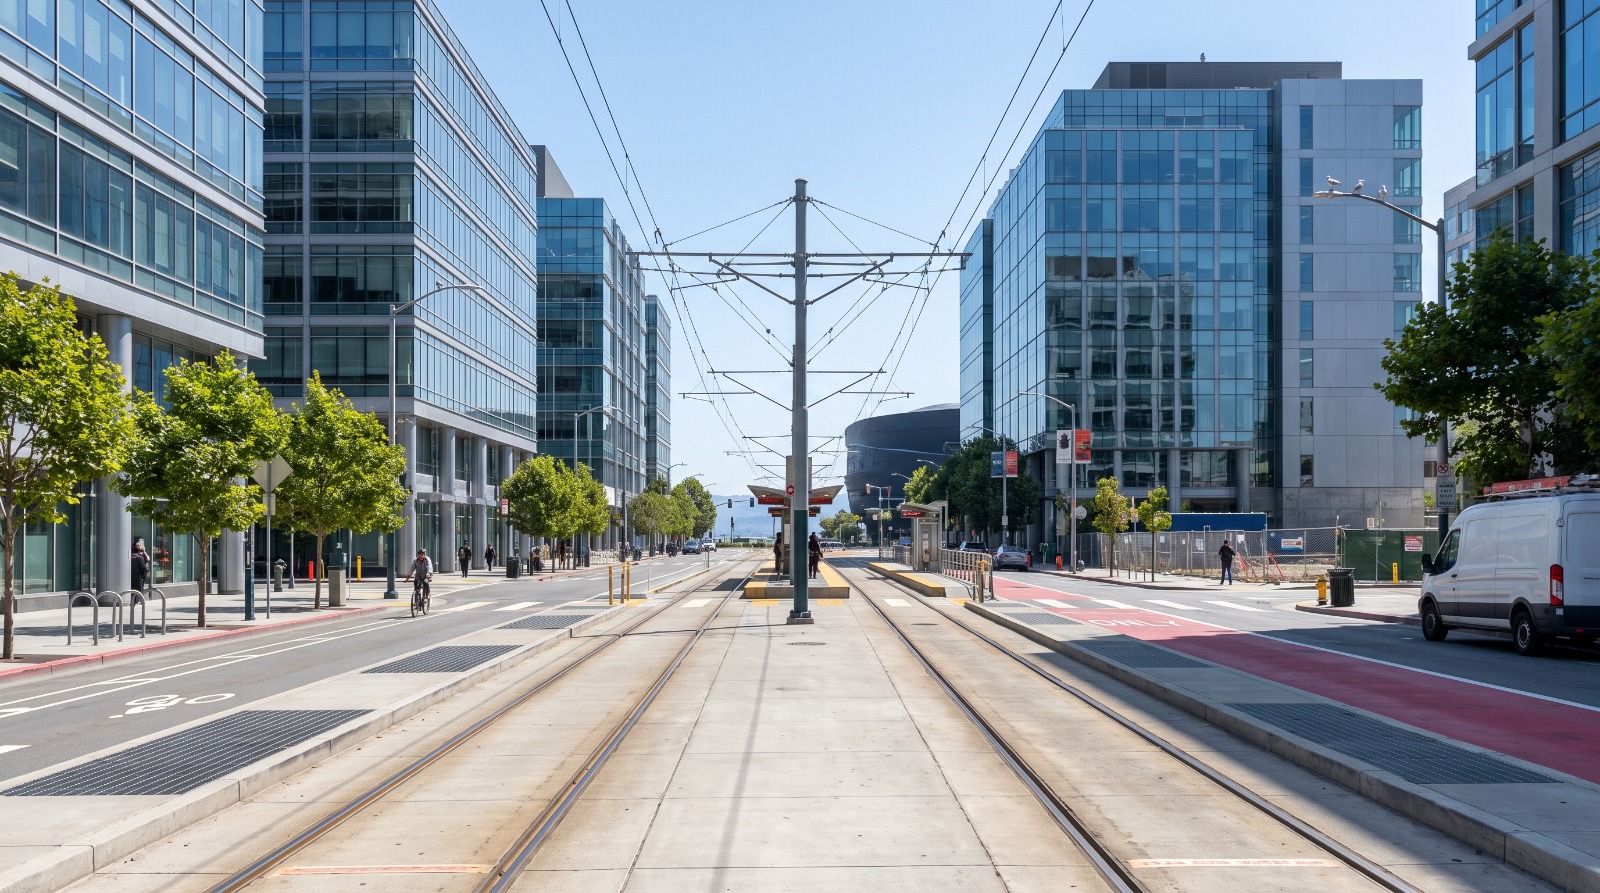
Third Street in Mission Bay, San Francisco, with Muni T-line tracks running between mid-rise life-science and office buildings near the AI office cluster. Photo: Houseberry
Stand on Third Street in Mission Bay on a Tuesday morning and it feels like a different city than it did in 2022. The T train is full. There is a line at the coffee place under the parking podium. Somewhere in the glass buildings on either side of you, a little over a million square feet belongs to OpenAI.
Walk twenty minutes northwest to Howard Street and the buildings are just as full, the leases just as large, and the block is a completely different place to live. That is the thing the AI office story keeps missing. The boom did not land on one San Francisco. It landed on two, and by our scores they sit 31 places apart in the city ranking.
AI tenants now occupy roughly 8.5 million square feet of San Francisco office space, about a tenth of the city's inventory, up from 23 companies and 1.1 million square feet in 2022. That headline number is softer than it looks. 8.5 million against JLL's 87-million-square-foot market is 9.8 percent, but against Kidder Mathews's count of 103.5 million it is 8.2 percent. Where it landed is the part worth your attention.
Where the offices went
The boom is not spread across the city. It is three clusters, and they are small enough to walk between.
The first is Mission Bay and China Basin. OpenAI has assembled about 1.2 million square feet across 1455 and 1515 Third Street, 550 Terry Francois Boulevard and 1800 Owens Street. Sierra took 300,000 square feet at 185 Berry. Office vacancy in that submarket has fallen below 9 percent, in a city where the overall rate is somewhere around 30 percent depending on whose count you take.
The second is a six-block stretch of Howard Street in South of Market, which The San Francisco Standard reports brokers have taken to calling AI Alley. Anthropic has committed to roughly 995,000 square feet along it, including the full 25-story tower at 300 Howard. Harvey took 150,000 square feet a few blocks over at 201 Third.
The third is the flats below Potrero Hill, around the Design District and Showplace Square. Scale AI at 650 Townsend, together.ai at 2 Henry Adams, Abridge at 208 Utah. Smaller leases, tighter geography, and the one cluster where the housing next door is not downtown housing.
Two places that come up in every conversation about this are not in it. Hayes Valley and Mid-Market have no anchor AI lease. Beyond Chron's January survey of Mid-Market found the sixteen-story building across from 986 Market still largely empty and reported that the drug market at Sixth and Market was unchanged. If you are buying on the theory that the boom will wash over the Tenderloin, the leasing data does not support you yet.
Two blocks apart, 31 ranks apart
Rank the corridor neighborhoods against all 92 San Francisco neighborhoods on our Overall score and they do not cluster. They split down the middle.
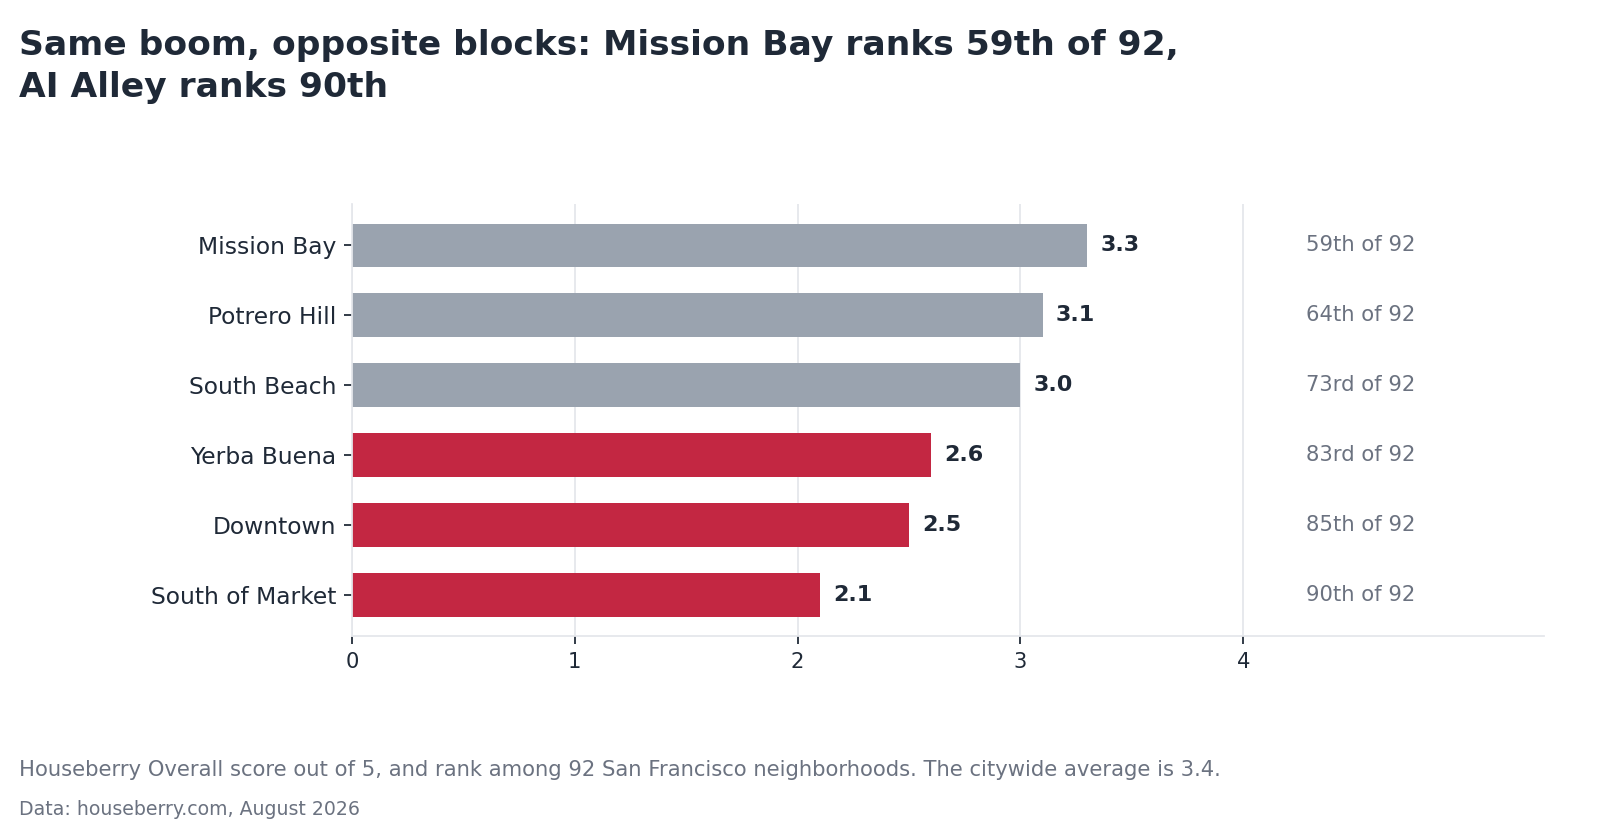
Mission Bay sits at 3.3 overall, 59th of 92, with a 3.9 safety score. That is a perfectly ordinary San Francisco neighborhood by the numbers, and the largest single AI footprint in the city is inside it. South of Market scores 2.1 overall and 1.9 on safety, 90th of 92, and it holds nearly a million square feet of Anthropic. Downtown is 85th. Yerba Buena is 83rd.
It is the same boom, the same walking distance, and the same commute. The neighborhoods are not interchangeable and treating "near the AI offices" as one location will steer you badly.
| Neighborhood | Overall | Rank | Safety | Amenities | Median price |
|---|---|---|---|---|---|
| Mission Bay | 3.3 | 59th | 3.9 | 3.6 | $2.21M (July 2026) |
| Potrero Hill | 3.1 | 64th | 3.4 | 3.4 | $2.08M (July 2026) |
| South Beach | 3.0 | 73rd | 3.6 | 3.8 | $3.90M (June 2026) |
| Yerba Buena | 2.6 | 83rd | 2.2 | 3.8 | $2.65M (July 2026) |
| Downtown | 2.5 | 85th | 2.4 | 3.4 | $3.05M (July 2026) |
| South of Market | 2.1 | 90th | 1.9 | 3.2 | $1.70M (July 2026) |
Now read the price column against the score column, because the market has already worked this out. South of Market is the cheapest neighborhood in the corridor at $1.70 million and the lowest-scoring. Downtown scores two and a half and asks $3.05 million, because you are buying a view and a doorman rather than a neighborhood. Mission Bay, the best-scoring of the six, costs $500,000 more than SoMa and half a million less than Downtown.
The cheapest housing in the corridor sits directly on top of the biggest office cluster in it. That is what a 1.9 safety score does to a price, and no amount of leasing activity has moved it yet.
Potrero Hill is the quiet answer
Potrero Hill scores 3.1 overall and 64th of 92, at a July 2026 median of $2.08 million. That is the cheapest of the six except SoMa, and it is the only one on the list that feels like a neighborhood rather than a district.
The commercial strip on 18th Street between Connecticut and Texas is four blocks of the ordinary things people use on a Tuesday. The hill is steep enough to be annoying and high enough that the view down to the Bay Bridge does most of the work. Scale and Abridge and together.ai are all a ten-minute downhill walk away in the flats, which is the whole appeal: close to the cluster, not in it.
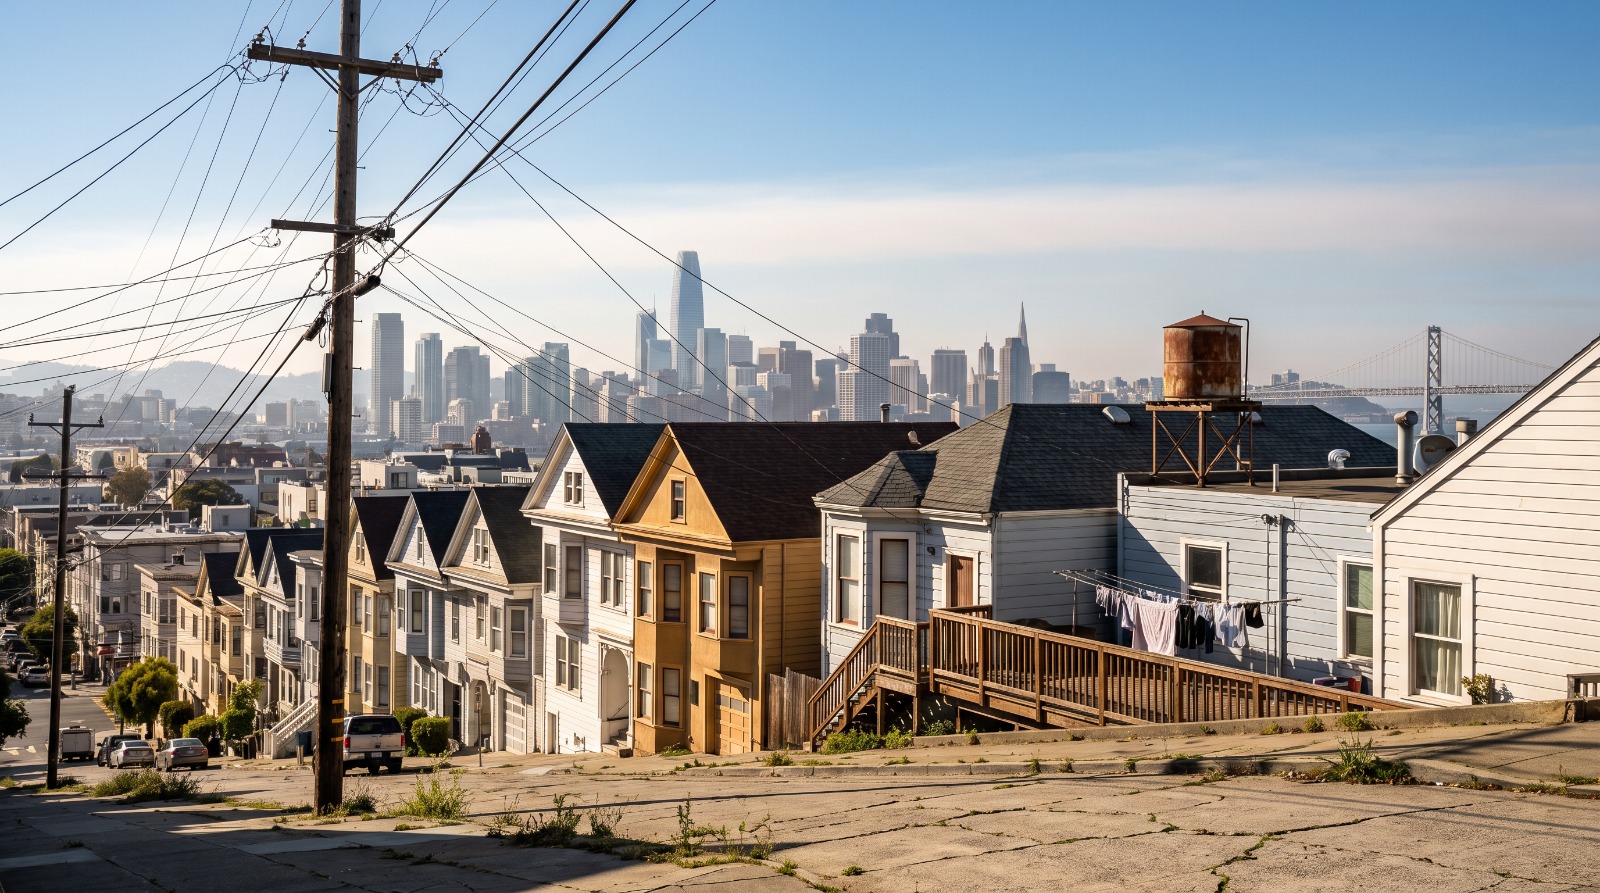
The trade-off is real: 3.4 on safety and 3.4 on amenities are both a shade under the citywide average, not standout. Nobody should buy there expecting Sunset numbers. The honest pitch is that it is a middle-of-the-pack neighborhood at a corridor-adjacent price, which is a different and better thing than a bottom-decile neighborhood at a corridor price.
The number I would watch is rent
Office leases are a slow signal. Rent is a fast one, and San Francisco's rent is moving in a way that should worry anyone who cares about this city staying livable for the people already in it.
Median asking rents rose 23.1 percent between July 2025 and July 2026, including a 3.9 percent jump in July alone. Apartment vacancy fell to 2.2 percent from 5.1 percent in 2024. A one-bedroom now runs about $3,750, the most expensive in the country. Apartment List's explanation is one sentence long and hard to argue with: when other cities built, San Francisco did not.
There is no version of 8.5 million square feet of new office demand that does not turn into either housing or price, and San Francisco has picked price for about fifteen years running. The AI companies did not create that. They are the current thing pressing on it.
Hold the boom itself loosely, too. Two tenants, OpenAI and Anthropic, account for roughly a quarter of all AI office space in the city. Badge-scan data still puts San Francisco office attendance under half of pre-pandemic levels, so leased square footage and daily human beings are not the same measurement. And OpenAI already took 202,000 square feet in Richmond, across the bay, which tells you something about where these companies think their workers want to live.
How I would actually think about this
If you work in one of these buildings and you are house-hunting, treat the AI corridor as a commute destination rather than a housing recommendation. Plenty of the people filling those offices live in the Richmond, the Sunset, Noe Valley, Oakland and Marin, and they are not making a mistake. Our San Francisco neighborhood rankings cover all 92, and the ones that score best are nowhere near an AI lease.
If you are looking at a condo in SoMa because the block is clearly changing, look at what you are buying now rather than what you are buying in five years. A 1.9 safety score and a 2.1 overall describe the next few years, whatever happens to the office market. What would move them is not another lease. Street-level investment, ground-floor retail actually filling, housing built for residents rather than for absorption, and those show up slowly, in the scores, long after they show up in a press release.
And if you are somewhere else in the city watching your rent climb 23 percent: the leases are signed and the supply response so far is a rounding error. Whether San Francisco builds into this boom or prices through it is the question the next two years answer, and it will be visible in the rent long before it is visible in anyone's quarterly office report.
Sources
- The Registry: AI now fills 10 percent of San Francisco office supply, August 2026
- Allwork.space coverage of the same JLL data, August 12, 2026
- Cushman and Wakefield San Francisco office MarketBeat, Q2 2026
- Kidder Mathews San Francisco office market report, Q2 2026
- JLL on the San Francisco office market turnaround, March 4, 2026
- The San Francisco Standard: ranking SF's biggest AI companies by office size, April 7, 2026
- Apartment List: San Francisco's rental market is booming again, July 29, 2026
- Beyond Chron: A Mid-Market comeback in 2026, January 12, 2026
- Houseberry neighborhood and city data, June to August 2026
Map of San Francisco Neighborhoods
Loading map...
View Full Map
Top Neighborhoods in San Francisco, CA





All information provided on this website including but not limited to - school ratings, safety, amenities, user opinions, and property data - is for general informational purposes only. We do not guarantee its reliability, accuracy, or completeness. Users should independently verify information and consult appropriate professionals as needed. By using this website, you agree Houseberry is not responsible for actions, decisions, or consequences arising from reliance on the information provided
houseberry.com - CA DRE# 01847391
 Bay East ©2025. CCAR ©2025. bridgeMLS ©2025. Information Deemed Reliable But Not Guaranteed. This information is being provided by the Bay East MLS, or CCAR MLS, or bridgeMLS. The listings presented here may or may not be listed by the Broker/Agent operating this website. This information is intended for the personal use of consumers and may not be used for any purpose other than to identify prospective properties consumers may be interested in purchasing. Data last updated at October 1, 2026 12:00 AM