San Francisco Housing Affordability: What Broke It
San Francisco rents are rising faster than anywhere in the country while the citywide median sale price has fallen. We sorted the real numbers from the viral ones and looked at where the money is actually going.
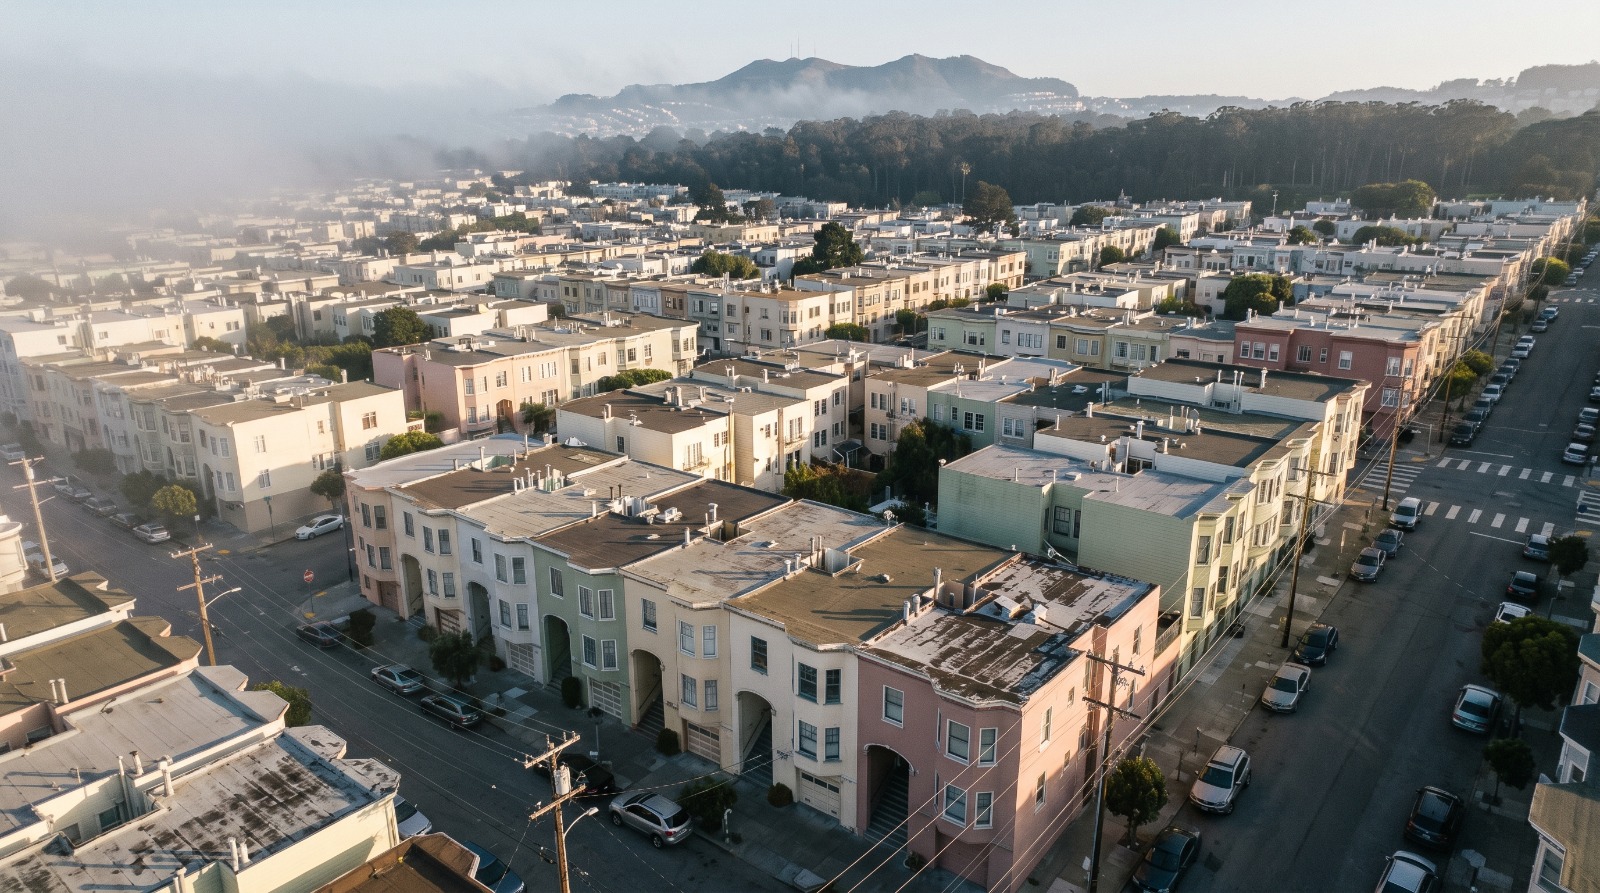
Aerial view of dense pastel row houses in San Francisco's Outer Sunset, the housing stock at the center of the city's affordability debate. Photo: Houseberry
Ask ten people in this city who broke San Francisco housing affordability and you will get ten answers, most of them about somebody else. Here is the version the August 2026 numbers support: the crisis right now is rent, not sale prices. Two-bedroom asking rents hit a median of $6,020 in July 2026, up 25.9% in a year. Over roughly the same stretch, the citywide median sale price on our own data fell from $1.64 million to $1.33 million.
Both of those are true in the same city, in the same month. That contradiction is the whole story, and almost nothing you will read about SF prices this week addresses it.
The rent number everyone is quoting is the highest one available
The 25.9% figure is real, but it is the single most dramatic slice of the data. It is the two-bedroom asking rent from one tracker. Broader measures are lower.
Apartment List put San Francisco's median rent at $3,446 in June 2026, up 16.9% year over year. CoStar had the metro closer to 11%. Same city, three answers, because they are counting different things: asking rents on new listings versus a blended median across all unit sizes versus the whole metro.
The more useful comparison is not between the trackers. It is between San Francisco and everywhere else. Apartment List had national rents down 1.5% year over year in June 2026 while San Francisco was up 16.9%, first among the 100 largest US cities. Rents are falling nationally. Here they are setting records. That gap is the fact worth carrying around.
The supply side of the rental market explains part of it. Active rental listings in San Francisco were down 30% year over year as of July 2026. Fewer units chasing more people is not a mystery, it is arithmetic.
Sale prices went the other direction
Our own citywide median has been falling for most of a year. San Francisco's median sale price across all property types peaked at $1.64 million in July 2025, bottomed at $1.26 million in May 2026, and ticked back up to $1.33 million in June 2026. That is a drop of roughly 19% over 12 months.
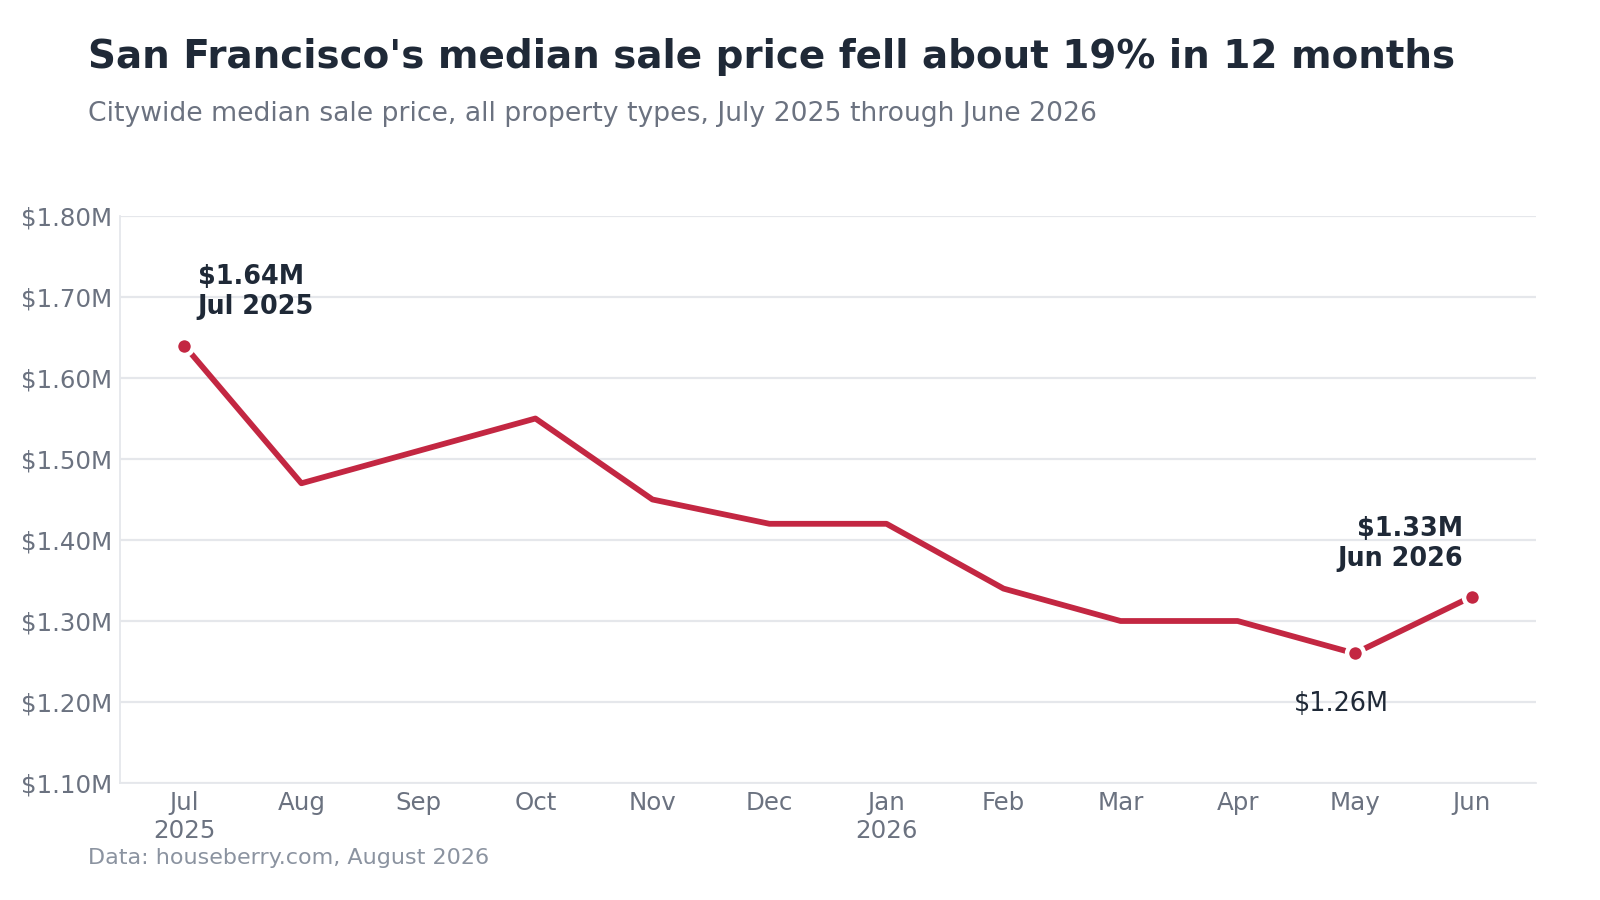
Before anyone forwards this to their listing agent: a falling median is not the same as falling home values. The median moves with what happens to sell. A year heavy on condos and light on single-family houses drags the number down even if every individual house held its price.
That is also why you will see three different medians quoted for the same city. Redfin put SF at $1.725 million in June 2026. Compass, counting houses only, reported a record $2.15 million in March 2026. Ours is $1.33 million because it includes condos, which are the softest part of this market. All three are defensible. None of them is interchangeable, and anyone who quotes one without saying what is in the basket is guessing.
The two trillion dollar number is off by about ten times
The claim making the rounds is that the Anthropic and OpenAI IPOs will pour roughly $2 trillion into the San Francisco buyer pool. That number is a company valuation, not money going into houses.
The only real estimate of what actually reaches employees comes from Redfin, and it is about $198 billion post-tax, or enough to buy roughly 29% of every home in San Francisco. Still an enormous number. Still nowhere near $2 trillion. Redfin also says plainly that the calculation is hypothetical, because Anthropic has not disclosed its employee equity share.
Three figures are circulating in this conversation and two of them are being repeated wrong. Here is what the underlying sources actually say.
| What people are saying | What the source actually says | Source |
|---|---|---|
| SF rents up 26% | Up 25.9% for two-bedroom asking rents in July 2026. All-unit measures show 16.9% to 18%; the metro figure is near 11%. | Zumper, Apartment List, CoStar |
| AI IPOs add $2 trillion to the buyer pool | About $198 billion in post-tax employee equity. The $2 trillion is the two companies' expected combined market value. | Redfin, July 9 2026 |
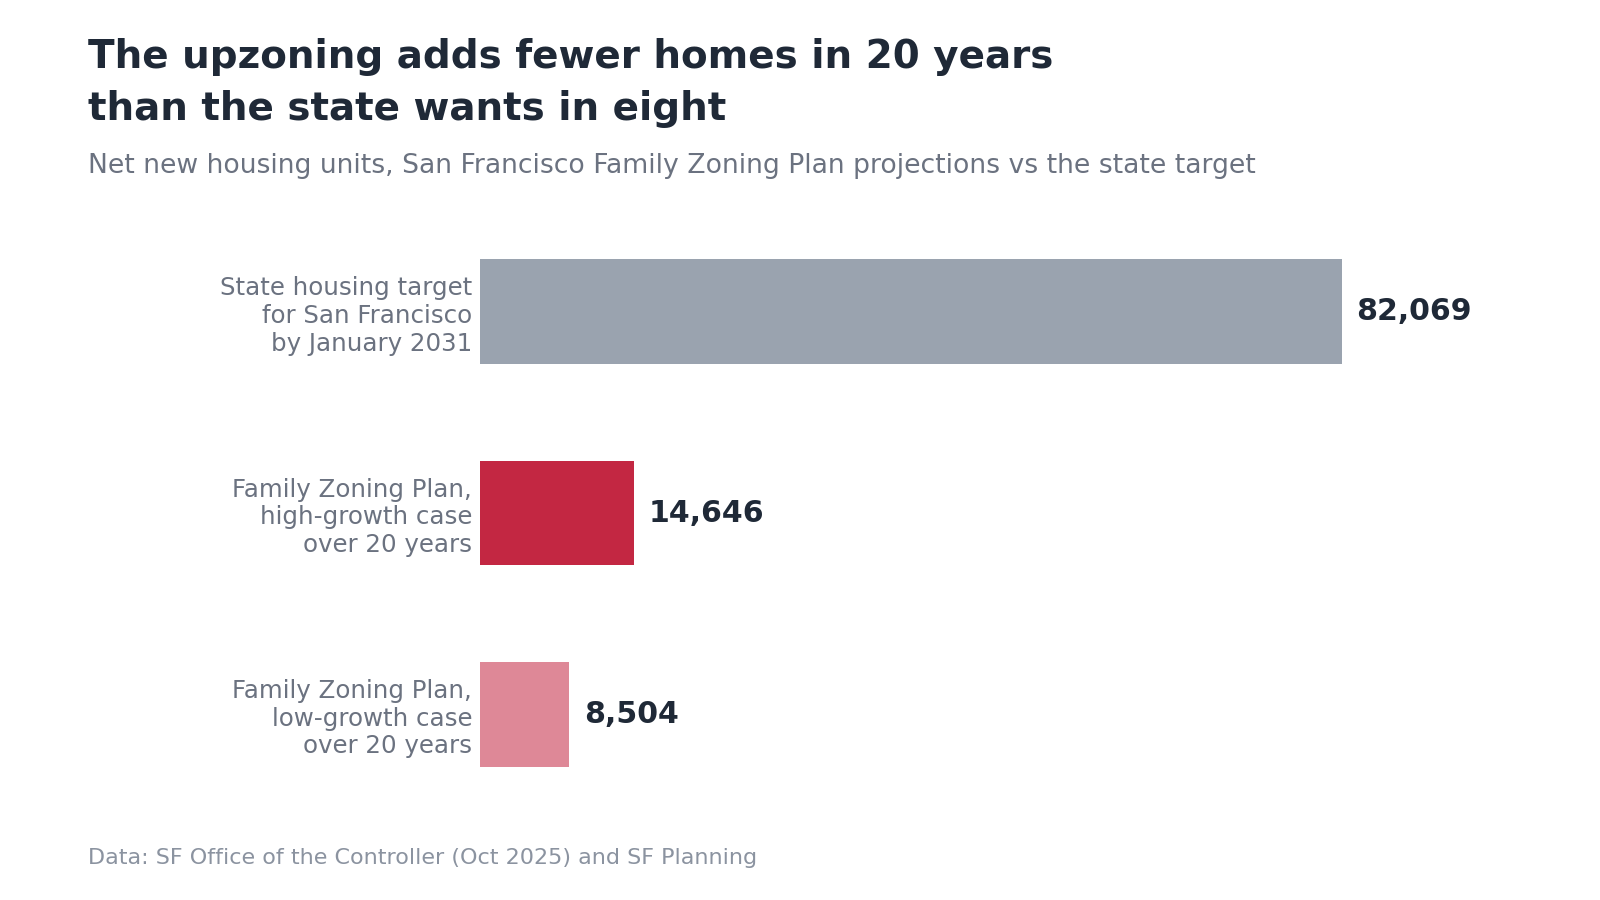
| The upzoning adds 14,600 homes | 8,504 in the low case, 14,646 in the high case, over 20 years. | SF Office of the Controller, October 2025 |
San Francisco built 2,669 homes last year
The supply side of a supply and demand story keeps getting left out, so here it is. San Francisco completed 2,669 net new homes in 2025, about 26% below its own 10-year average, and the Department of Building Inspection authorized roughly 1,900 units for construction that year. Affordable units made up 1,758 of the completions, meaning two thirds of everything built in the city last year was subsidized.
Set that against the state requirement. San Francisco has to plan for more than 82,000 homes by January 2031. In 2024 it authorized 1,074, its worst year since the financial crisis.
A city that builds two thousand homes a year and needs twelve thousand is not going to price its way out of anything. The market-rate pipeline is close to frozen, and the part that is moving is the part the city pays for.
The upzoning was never going to fix this, and the city said so
San Francisco's own economist priced the Family Zoning Plan before it passed, and the answer was modest. The Office of the Controller projected in an October 2025 economic impact report that the plan adds between 8,504 and 14,646 net housing units over 20 years, and lowers rents by $903 to $1,529 a year, which is $75 to $127 a month.
The same report put the price effect at a 2.5% to 4.2% decline, or $24,500 to $41,600 off a condo, spread across two decades.
Worth being precise about one thing, since the plan keeps getting attached to the wrong mayor. The Family Zoning Plan came out of the 2023 Housing Element rezoning mandate, was adopted by the Planning Commission in September 2025, approved by the Board in December, and signed by Mayor Lurie on December 12, 2025. He signed it. He did not invent it.
We are firmly on the side of building more, and this plan is a real improvement over the status quo. It is also not a rescue. Anyone selling it as one is setting up the next round of disappointment.
The part nobody mentions: the city is losing jobs
Here is the fact that breaks most of the explanations you will read. San Francisco and San Mateo counties lost 4,400 jobs in 2025, including 4,500 in the information sector, during the loudest stretch of the AI boom. OpenAI and Anthropic together employ fewer than 10,000 people.
So the standard story, that a hiring surge is bidding up housing, does not survive contact with the employment data. What is happening looks more like a small number of very well capitalized buyers and renters concentrated in a city with a frozen pipeline and 30% fewer rental listings than a year ago.
That distinction matters if you are making a decision. A broad hiring boom lifts a whole region's housing demand for years. A concentrated wealth event in a supply-constrained city shows up as record rents and a bifurcated sale market, which is exactly what the 2026 numbers look like.
Where the money is not going
This is the part our data is built for, and it is where the affordability conversation gets interesting. In San Francisco, paying more does not reliably buy a better-scoring neighborhood.
Outer Sunset, the westernmost grid of avenues between Golden Gate Park and Ocean Beach, scores 4.5 out of 5 overall on Houseberry and ranks first of the 92 San Francisco neighborhoods we score. Its median sale price was about $1.50 million in June 2026. Noe Valley, the sunny bowl south of the Castro, scores 3.4 and ranks 55th, at a median of about $2.53 million in the same month.
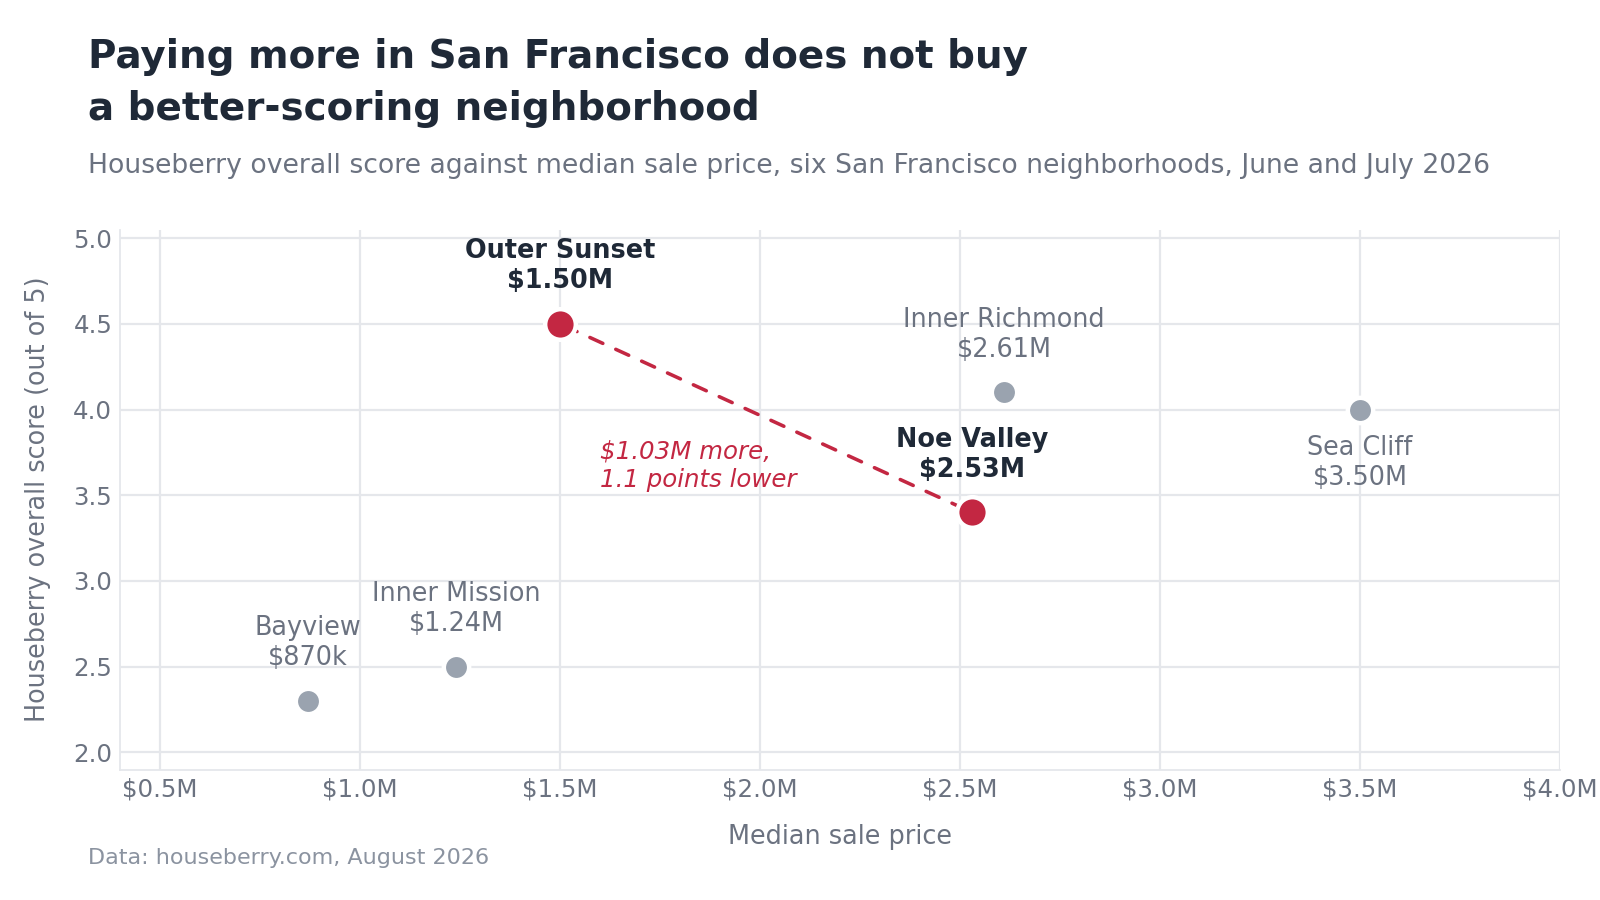
That is roughly a million dollars of premium for a neighborhood our data rates a full point lower on schools, safety and amenities combined. The premium is buying weather, proximity to the center, and a decade of reputation. Those are real things people are entitled to pay for. They are just not the things a neighborhood score measures.
| Neighborhood | Median sale price | Overall | Schools | Safety |
|---|---|---|---|---|
| Outer Sunset | $1.50M (June 2026) | 4.5 | 4.5 | 4.8 |
| Inner Richmond | $2.61M (July 2026) | 4.1 | 4.4 | 4.4 |
| Sea Cliff | $3.50M (July 2026) | 4.0 | 3.8 | 4.5 |
| Noe Valley | $2.53M (June 2026) | 3.4 | 2.7 | 4.0 |
| Inner Mission | $1.24M (June 2026) | 2.5 | 1.8 | 2.8 |
| Citywide | $1.33M (June 2026) | 3.5 | 3.3 | 3.8 |
Read down the score columns and then down the price column. They do not move together. If your budget tops out well below the citywide median, the west side is where the scores stay high, and the full San Francisco ranking is not a list most buyers would guess.
Four questions I get about this every week
Is it cheaper to rent or buy in San Francisco right now?
For the first time in a long while the math is closer than it was. A $6,020 two-bedroom rent is roughly $72,000 a year before anything else. At a 30-year fixed rate near 6.7%, a $1.33 million purchase with 20% down runs well past that once taxes and insurance are in, so buying is still the more expensive monthly line. The gap is narrowing from the rent side, not the price side.
Will the OpenAI and Anthropic IPOs push prices higher?
At the top of the market, almost certainly, and it is already visible in single-family sale prices. Across the whole city, the effect is smaller than the headlines suggest. About $198 billion in employee equity is a lot of money, but it belongs to fewer than 10,000 people who mostly already live here.
Which San Francisco neighborhoods still offer value?
On our scoring, the west side. Outer Sunset is the clearest case, and Central Sunset, Outer Parkside and Inner Parkside all score above 4.2 overall. The trade-off is fog, distance from downtown, and thinner walkable retail.
Is the market going to correct?
Parts of it already have. Inner Mission went from a $2.42 million median in September 2025 to about $1.24 million in June 2026. Condos have been soft citywide for a year. The single-family house market and the rental market are the two that have not corrected, and neither looks likely to while the pipeline stays this thin.
What this does and does not mean
It does mean that if you are renting in San Francisco in 2026, you are in the worst rental market in the country by rate of increase, and no policy currently on the books changes that before 2030.
It does not mean the city is uniformly expensive. A 19% drop in the citywide median is real movement, condos are cheaper than they were, and the neighborhoods our data scores highest are not the ones with the highest prices.
The practical move is the same one we built Houseberry around: compare the area before you compare the listings. A score gap of a full point between two neighborhoods a million dollars apart is not a rounding error, and it is not visible from a listing page.
Sources
Mission Local, who killed housing affordability in San Francisco (August 3, 2026)
San Francisco Office of the Controller, Family Zoning Plan economic impact report (October 29, 2025)
San Francisco Planning, 2025 Housing Inventory (April 2026)
San Francisco Planning, SF Family Zoning Plan
Apartment List, San Francisco rent report (June 2026)
CBS News Bay Area on Zumper's July 2026 rent report
Redfin, OpenAI and Anthropic employee housing wealth (July 9, 2026)
Redfin, San Francisco prices $1 million above the crash bottom (July 23, 2026)
The San Francisco Standard on AI hiring and tech jobs (January 28, 2026)
All information provided on this website including but not limited to - school ratings, safety, amenities, user opinions, and property data - is for general informational purposes only. We do not guarantee its reliability, accuracy, or completeness. Users should independently verify information and consult appropriate professionals as needed. By using this website, you agree Houseberry is not responsible for actions, decisions, or consequences arising from reliance on the information provided
houseberry.com - CA DRE# 01847391
 Bay East ©2025. CCAR ©2025. bridgeMLS ©2025. Information Deemed Reliable But Not Guaranteed. This information is being provided by the Bay East MLS, or CCAR MLS, or bridgeMLS. The listings presented here may or may not be listed by the Broker/Agent operating this website. This information is intended for the personal use of consumers and may not be used for any purpose other than to identify prospective properties consumers may be interested in purchasing. Data last updated at September 18, 2026 12:00 AM