7 Percent Rates Just Took Two Bay Area Cities Off Your List
The 30-year fixed crossed 7 percent last week. For a buyer working from a fixed monthly budget, that is not a smaller house. It is a shorter list of cities.
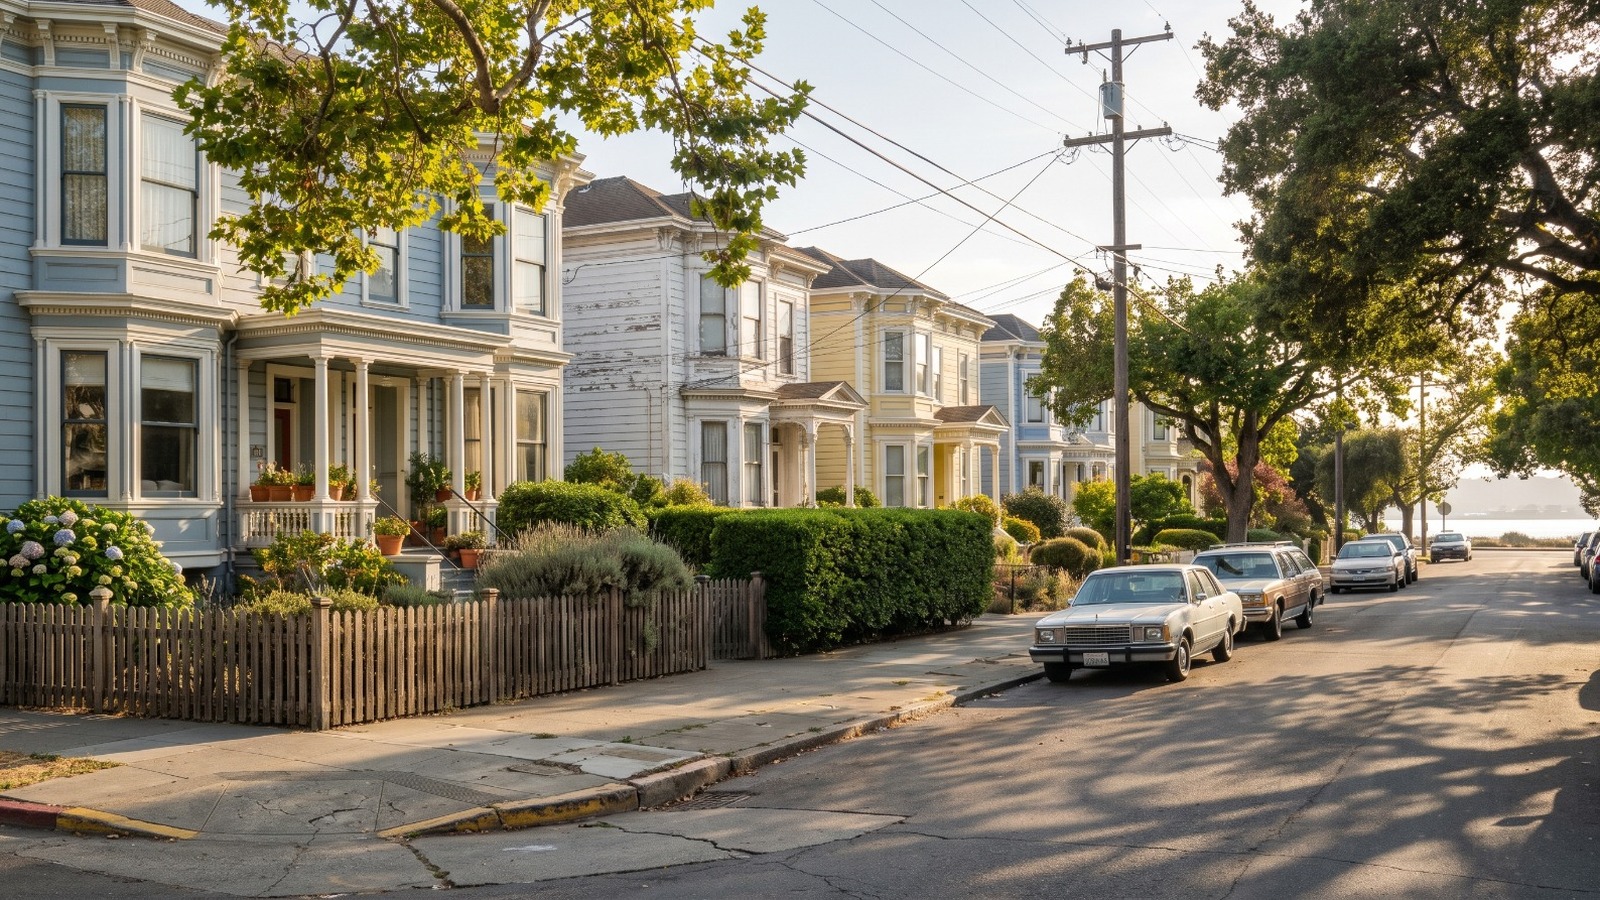
A flat residential street of Victorian homes in Alameda, California, one of the Bay Area cities a 7 percent mortgage rate just pushed out of reach. Photo: Houseberry
The daily 30-year fixed rate crossed 7 percent last week, running 6.89 to 6.97 to 7.07 percent in three sessions and printing 7.08 on Friday, the highest since May 2025. Every outlet is running the payment math today. Here is the version that decides where you end up living. A buyer holding $7,500 a month for principal and interest, with 20 percent down, could reach about $1.54M in January. The same payment reaches about $1.40M now. Laid across our own Bay Area city medians, that $139,000 is Alameda and Walnut Creek dropping off the list.
Your feed has two different rates in it, and both are real
Both numbers are accurate. They measure different things, and the gap between them is running about 32 basis points.
Freddie Mac’s Primary Mortgage Market Survey is a weekly average built from lender applications, and it read 6.76 percent on September 10, up from 6.71 the week before and 6.35 a year earlier. A daily lender index put the 30-year at 7.08 percent the next morning. NerdWallet quoted 7.09 percent APR on Monday. When the market moves 18 basis points in three sessions, a weekly average is still describing last Tuesday.
If you are shopping this week, the daily number is the one a lender will actually quote you. Use that one.
The direction is the part most people have backwards. Nobody is pricing a cut. On Monday morning the CME FedWatch odds of a quarter-point hike at the meeting ending Wednesday topped 88 percent, up from just under 60 percent a week earlier, after August CPI printed 3.4 percent annual and core 2.4 percent. The 10-year Treasury sat at 4.949 percent, near a 52-week high. Mortgage pricing tracks that 10-year far more closely than it tracks the Fed’s own target, which is why we argued back in July that a Fed decision is rarely the thing that moves your payment.
Nine percent, at every price point
Run the amortization at 6.16 percent and again at 7.08 percent and the ratio comes out the same wherever you start. A fixed monthly payment buys 9.1 percent less house than it did in January. Below, 30-year fixed, 20 percent down, principal and interest only.
| Monthly principal and interest | Purchase price at 6.16% (January) | Purchase price at 7.08% (now) | What the year cost |
|---|---|---|---|
| $5,000 | $1,024,800 | $931,900 | $92,900 |
| $7,500 | $1,537,200 | $1,397,800 | $139,400 |
| $10,000 | $2,049,600 | $1,863,800 | $185,800 |
What changes with the price point is the dollar size of the loss, and around here the dollars are the part that stings. The $92,900 at the top of that table is roughly a bedroom. The $185,800 at the bottom is a different school district.
Nothing about the houses changed. The whole gap is the cost of borrowing.
Where nine percent lands on an actual map
Percentages are abstract. City medians are not. We keep a current median on every city page, so it is straightforward to lay both budget lines across the region and see what is sitting between them.
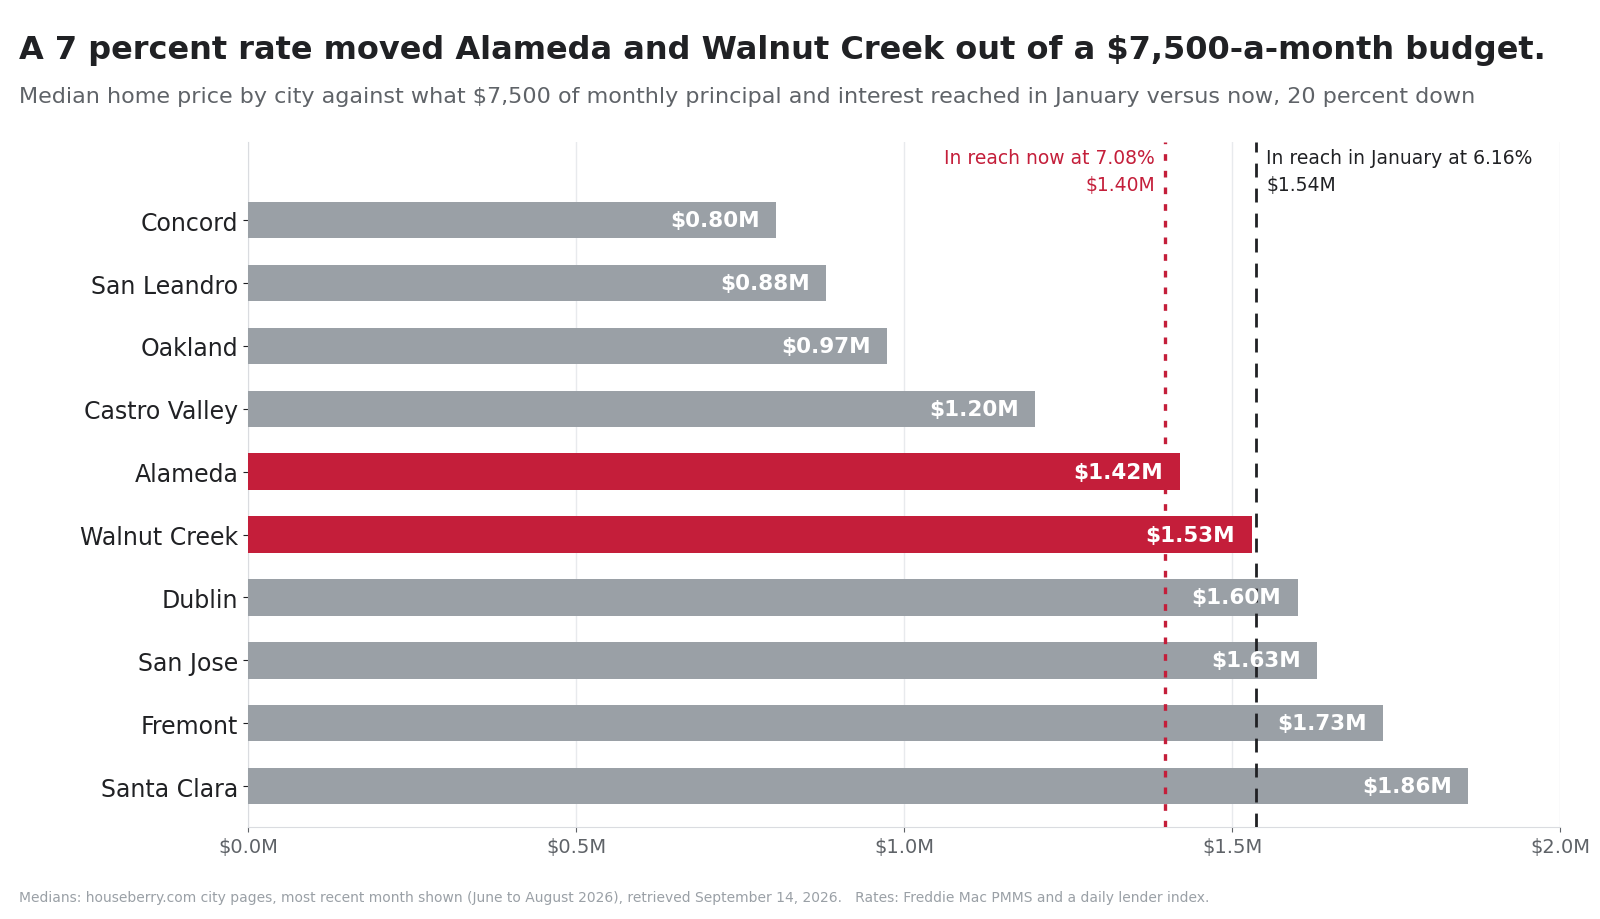
In January a $7,500 payment cleared both. Today it clears neither.
Below the band, Castro Valley at $1.20M, Oakland at $974,220, San Leandro at $881,180 and Concord at $804,560 are all still comfortably inside. Above it, Dublin, San Jose, Fremont and Santa Clara were already out of reach in January and are further out now. The rate move did not change their status at all. It only took out the two cities that happened to be standing on the line.
That is the part worth internalizing. A rate move does not shrink your search evenly. It deletes whatever was sitting in the gap.
The city still in the budget scores better than the two that left
Here is where it stops being bad news.
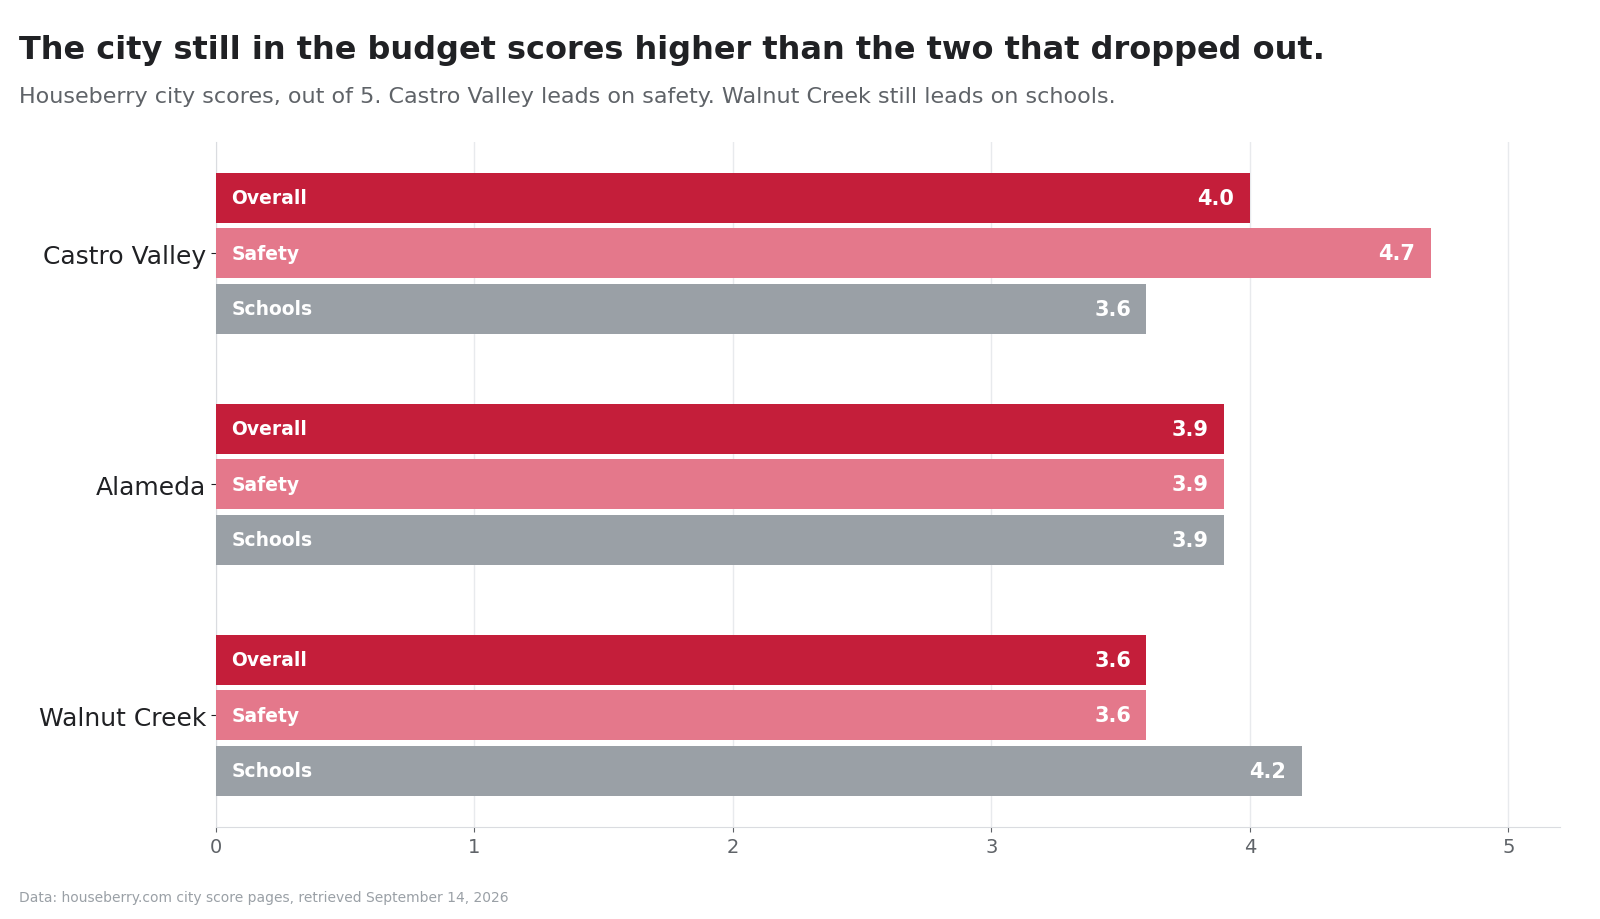
Castro Valley scores 4.0 out of 5 overall and 4.7 on safety, third of 16 places in Alameda County. Alameda scores 3.9 on all four factors, an unusually even profile. Walnut Creek scores 3.6 overall. On the composite, the city this buyer can still afford rates higher than the two that just fell off.
The honest counterweight is schools. Walnut Creek scores 4.2 there against Castro Valley’s 3.6, and if you have a kindergartner that half point is probably worth more to you than the safety gap. Composites hide trades like that, which is why we publish the four factors separately instead of one number.
The broader point holds, and it is the reason we built Houseberry around the area rather than the address. Price and quality are only loosely coupled in this region. A 9 percent budget cut moves you down the price ladder. It does not automatically move you down the quality ladder, and the only way to find out which happened is to look at the places rather than the listings.
Alameda County puts a shelf at $1,249,125
There is a second Bay Area wrinkle the national coverage will skip. FHFA set the 2026 baseline conforming loan limit at $832,750, and high-cost counties get 150 percent of that, which works out to $1,249,125. Alameda County sits at that ceiling. So does Marin.
Cross it and the loan becomes a jumbo. On Friday the same lender index quoting 7.08 percent on a conforming 30-year quoted 7.25 percent on a jumbo, a 17 basis point penalty applied to the entire balance rather than to the slice above the limit.
With 20 percent down, a $1,249,125 loan corresponds to a purchase price of about $1,561,400. That is a shelf. Bidding $20,000 past it can reprice the whole mortgage. Our $7,500-a-month buyer no longer goes anywhere near it, but the buyer one rung up does, and that buyer should know exactly where the edge sits before writing an offer in Alameda, Berkeley or Fremont.
What this does not mean
Four honest limits on the arithmetic above.
Monthly medians bounce. Rockridge’s page shows $1.24M in April and $2.26M in May of this year, which is thin volume rather than a real swing. Treat one month as a reading, not a verdict.
The months are not identical. Walnut Creek’s $1.53M is June 2026 because that is its most recent priced month. The others are July or August. A $10,000 difference between two cities on that chart is noise.
A median is not a listing. There are homes in Walnut Creek under $1.40M and homes in Castro Valley over it. What the median tells you is where the mass of the market sits, which is exactly what a search filter does to you.
And 9.1 percent is history, not a forecast. If the Fed hikes on Wednesday and the 10-year keeps climbing, the number gets worse. If the next inflation print reverses, it gets better. What we can say is what the year has already done, which is the only figure worth planning around.
If your list just got shorter, staring at rate charts will not help. Looking one rung down will. The East Bay ranking is where we would start, because the cities in that $800,000 to $1.3M band are the ones this rate move just made relevant.
Sources
- Freddie Mac, Primary Mortgage Market Survey (30-year fixed, September 10, 2026)
- Freddie Mac data shows the 30-year hovering near 6 percent to start 2026, Scotsman Guide (January 8, 2026 reading)
- Marin mortgage and market update, September 11, 2026, DiVita Home Finance (daily 30-year and jumbo index)
- Mortgage rates today, Monday, September 14, 2026, NerdWallet (rate and CME FedWatch odds)
- FHFA announces conforming loan limit values for 2026
- Alameda County conforming loan limits 2026, Community First Mortgage
- Median home prices and neighborhood scores: houseberry.com city pages, retrieved September 14, 2026
Map of East Bay Neighborhoods
Loading map...
View Full Map
Top Neighborhoods in East Bay, CA





All information provided on this website including but not limited to - school ratings, safety, amenities, user opinions, and property data - is for general informational purposes only. We do not guarantee its reliability, accuracy, or completeness. Users should independently verify information and consult appropriate professionals as needed. By using this website, you agree Houseberry is not responsible for actions, decisions, or consequences arising from reliance on the information provided
houseberry.com - CA DRE# 01847391
 Bay East ©2025. CCAR ©2025. bridgeMLS ©2025. Information Deemed Reliable But Not Guaranteed. This information is being provided by the Bay East MLS, or CCAR MLS, or bridgeMLS. The listings presented here may or may not be listed by the Broker/Agent operating this website. This information is intended for the personal use of consumers and may not be used for any purpose other than to identify prospective properties consumers may be interested in purchasing. Data last updated at September 14, 2026 12:00 AM