San Francisco Rent Is Up 23%. Vacancy Explains It
San Francisco's rental vacancy rate fell to 2.2% in July 2026, and that one number explains the rent headlines better than any of them do. Here is what it means for renters and for anyone comparing neighborhoods to buy in.
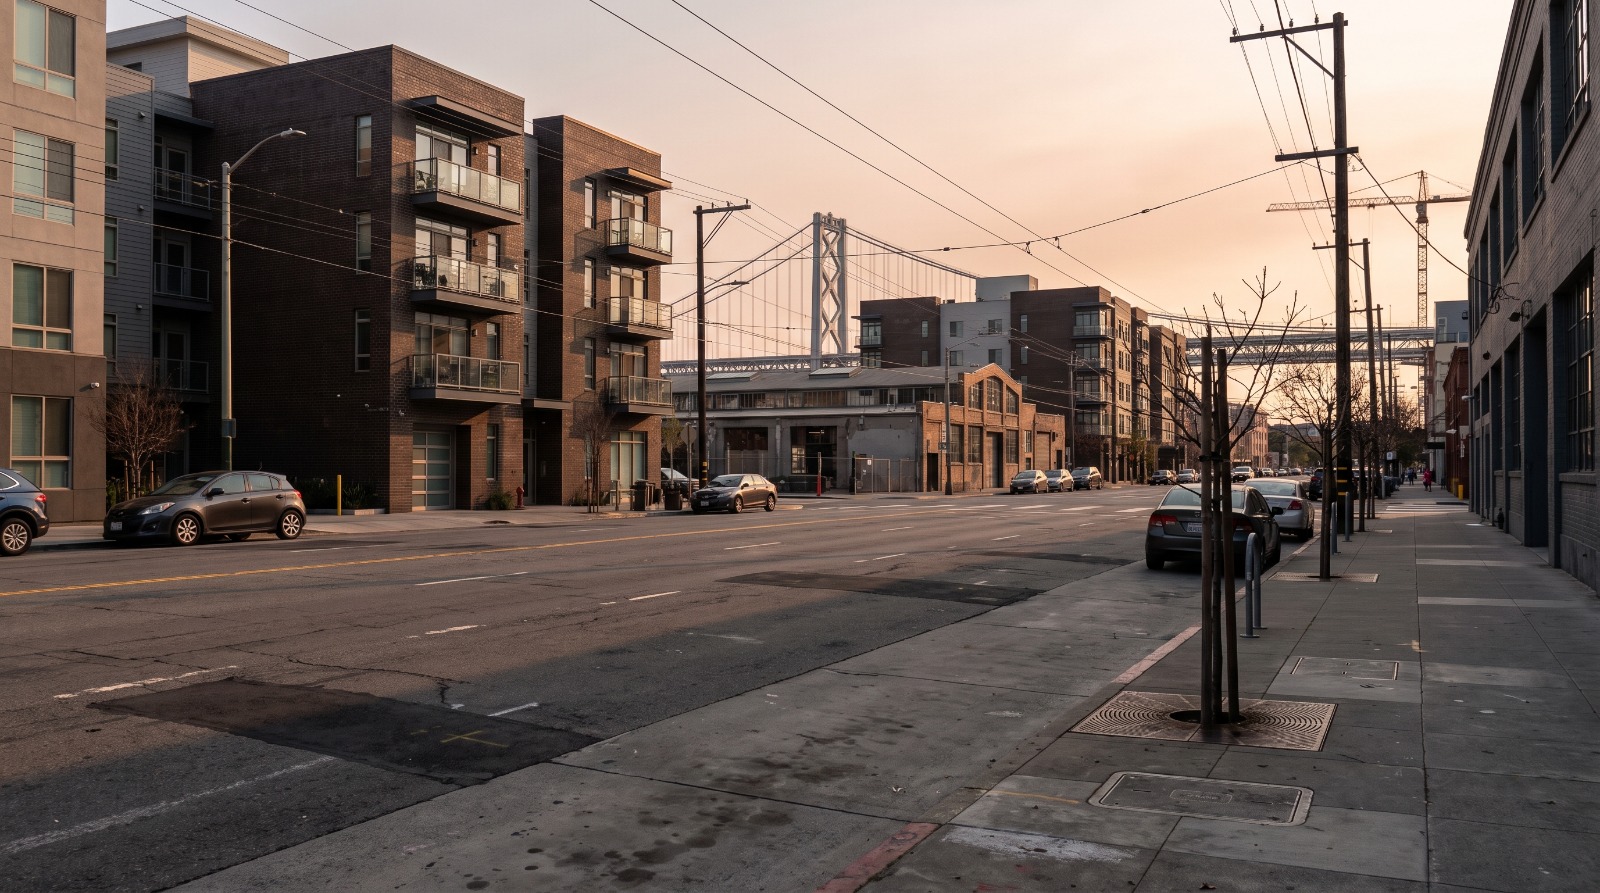
A South of Market street in San Francisco at sunset with mid-rise apartment buildings and the Bay Bridge in the distance. Photo: Houseberry
San Francisco's rental vacancy rate fell to 2.2% in July 2026, down from 5.1% in 2024. That single number explains the rent headlines better than the headlines do. Apartments now lease in a median of 16 days, barely half the national pace, and only a quarter of listings come with any kind of discount. The city ran out of empty apartments, and very little new supply is arriving to refill them.
Three numbers carry the whole story: vacancy at 2.2%, 16 days to lease, and about 1,400 new apartments expected in all of 2026. Everything else is downstream of those.
Vacancy fell by more than half in two years
A 2.2% vacancy rate means there is essentially no slack in the market. Apartment List, which publishes its own vacancy index, measured San Francisco at 2.2% in July 2026 after the city sat at 5.1% as recently as 2024.
The leasing speed tells you the same thing from the renter's side. San Francisco apartments went from listed to leased in a median of 16 days in July 2026, against a 30-day national average, the fastest pace since that tracking began in 2019.
At those numbers a renter has no leverage. You do not negotiate on a unit that will have three applications by Thursday. That is the practical difference between a 5% vacancy market and a 2% one, and it shows up in price long before it shows up in any index.
The free-month economy skipped San Francisco
Landlords in most of the country are competing on concessions. San Francisco landlords are not. Only 24.9% of San Francisco listings offered a concession in June 2026, against 39.7% nationally.
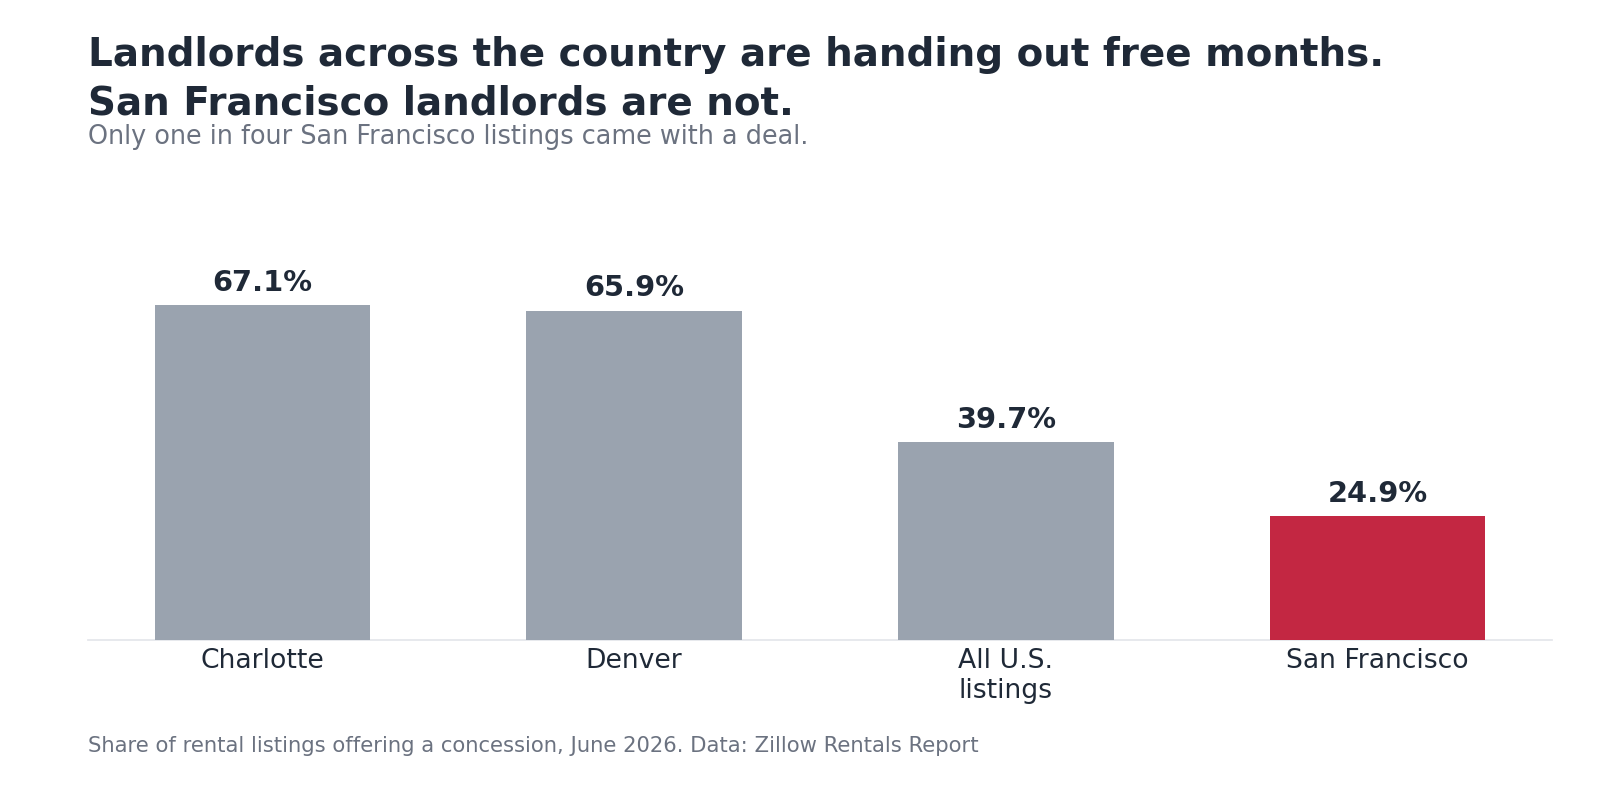
The gap matters because national rent softness is real. Charlotte was at 67.1% and Denver at 65.9%, both markets that built a lot of apartments and are now living with them. A free month on a $2,000 lease is a 8% discount that never appears in the asking-rent number. San Francisco renters are not getting that discount, so the headline rent is closer to the true rent here than it is almost anywhere else.
The AI boom is the demand side
The city's own economists have now put a cause on it. In an economic report released August 3, 2026, the San Francisco Controller's Office credited the AI investment boom for the turnaround and measured asking rents up 14% between March and July 2026.
The office numbers underneath that are the ones worth keeping. AI company office leases in San Francisco went from 2 in 2020 to 167 by early 2025, and the AI office footprint grew from 2.6 million square feet in 2022 to 4.8 million in 2024. Office vacancy has come down from a pandemic peak above 35% to roughly 30%, and city unemployment sits at 3.7%.
Chief Economist Ted Egan was careful about it, noting that AI "is eliminating jobs as well as adding jobs" and that job growth outside healthcare and tourism has been modest. Which is the honest version. A few thousand very well paid people bidding on a fixed number of apartments moves rent a lot, even if total employment barely moves.
Nobody fixed the supply side
San Francisco is on track to add about 1,400 apartments in 2026, roughly a 0.5% increase in inventory and the smallest annual delivery since 2012.
That is the part that turns a demand story into a crisis. A city can absorb an AI boom if it is building. San Francisco is not, and the pipeline that would fix 2028 needed to be approved in 2024. This is why the argument over whether asking rents are up 23% or 8% is less interesting than it sounds. Both numbers describe a market with 1,400 units coming and no vacancy.
The rest of the Bay Area is not doing this
The squeeze is specific to San Francisco. Rent growth across the rest of the region in July 2026 ran a fraction of the city's pace.
| City | Rent growth, year over year (July 2026) |
|---|---|
| San Francisco | 23.1% |
| Oakland | 13% |
| Mountain View | 11% |
| San Jose | 6.4% |
San Jose at 6.4% is a normal year. San Francisco at 23.1% is not. If you are renting now and deciding where to be in two years, that spread is the whole decision, and it is why we keep pointing people at how San Francisco's neighborhoods actually rank before they commit to a ZIP code on vibes.
In SoMa, rents went up while sale prices went down
Here is the split almost nobody is talking about. South of Market, the flat industrial-turned-residential district between Market Street and the Bay Bridge approach, had one-bedroom asking rents around $5,100 in July 2026, up roughly 42% year over year. Its median sale price went the other way.
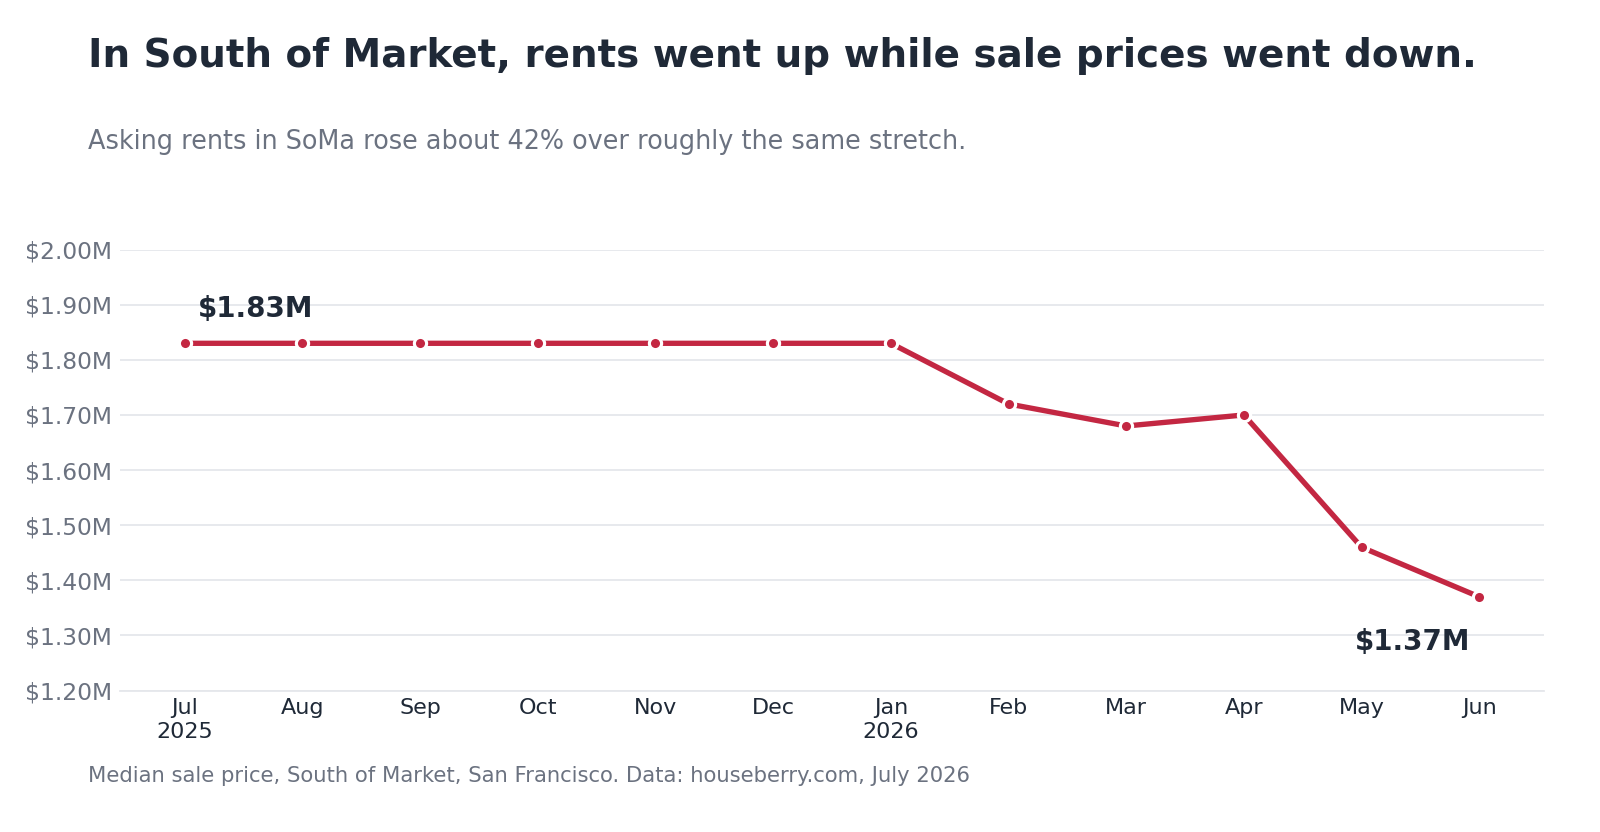
Our own price history for SoMa shows the median holding at $1.83M through January 2026 and then falling to $1.37M by June 2026. Rents up 42%, sale prices down about 25%, same blocks, same year.
The explanation is that SoMa's for-sale stock is overwhelmingly condos, and Bay Area condos have been weak while houses have not. But the practical read for a buyer is unusual and worth saying plainly: the neighborhood where renting got most expensive is one of the few where buying got cheaper. SoMa still scores 2.1 out of 5 overall on our data, 91st of 92 San Francisco neighborhoods, held down by schools at 1.4 and safety at 2.2. Those are real trade-offs, not a footnote.
What this does and does not mean
It does not mean every San Francisco renter is paying 23% more than last year. Asking rents describe what a new lease costs, not what sitting tenants pay, and the trackers disagree wildly about the size of the move. Zumper put one-bedroom growth at 22.9% for July 2026 while Zillow's repeat-rent index measured 8.2% for June. We went through that gap in detail when Essex reported 7.0% same-property revenue growth in San Francisco, which is audited, occupied-portfolio data and probably the closest thing to a true number.
The vacancy figure carries the same caveat. It is Apartment List's own index, not a census count. What makes it credible here is that the leasing speed and the concession data point the same direction, and those come from different companies.
What it does mean: if you are signing a new San Francisco lease in 2026, you are the marginal buyer in a market with no inventory, and you should expect to pay like it.
Questions people are asking
How much is a two-bedroom in San Francisco right now?
Zumper's July 2026 national report put the median two-bedroom asking rent at $6,020, the first time the city topped $6,000 and enough to pass New York. Zumper's own city page showed $5,950 in early August. Treat $6,000 as the neighborhood of the number, not a precise figure.
Why do Zumper and Zillow report such different San Francisco rents?
They measure different things. Zumper samples asking rents on new listings, which swing hard when the listing mix skews luxury. Zillow's index tracks the same units over time. For what a mover will pay, use Zumper. For the trend, use Zillow.
Which San Francisco neighborhoods are cheapest to rent?
The Tenderloin averaged about $2,226 in August 2026, the lowest in the city, with the Downtown and North Waterfront pockets next. The discount is real and so are the reasons for it.
Will San Francisco rents come down in 2027?
Not from supply. About 1,400 units arrive in 2026 and the approvals that would matter for 2028 have not happened. A pullback in AI hiring would do it faster than any building will.
The part that is actually in our control
Rent is a supply number wearing a demand costume. San Francisco got an employment shock it could not house, and 2.2% vacancy is what that looks like on the ground. The AI boom is not something the city chose or can switch off. The 1,400 units is.
For anyone deciding where to land, the useful move is to stop reading citywide averages and start comparing specific places, because the spread inside San Francisco is now wider than the spread between cities. That is the habit we built Houseberry around, and this year it is doing more work than usual. Start with the citywide picture, then go neighborhood by neighborhood, and read the rent number and the sale price as two different signals. In SoMa this year, they are telling opposite stories.
Sources
Apartment List, San Francisco's Rental Market Is Booming Again (July 2026)
The San Francisco Standard, AI boom and the SF Controller's economic report (August 3, 2026)
Zumper, National Rent Report (July 2026)
The San Francisco Standard, neighborhood rent records (July 2, 2026)
RentCafe, Average Rent in San Francisco (August 2026)
All information provided on this website including but not limited to - school ratings, safety, amenities, user opinions, and property data - is for general informational purposes only. We do not guarantee its reliability, accuracy, or completeness. Users should independently verify information and consult appropriate professionals as needed. By using this website, you agree Houseberry is not responsible for actions, decisions, or consequences arising from reliance on the information provided
houseberry.com - CA DRE# 01847391
 Bay East ©2025. CCAR ©2025. bridgeMLS ©2025. Information Deemed Reliable But Not Guaranteed. This information is being provided by the Bay East MLS, or CCAR MLS, or bridgeMLS. The listings presented here may or may not be listed by the Broker/Agent operating this website. This information is intended for the personal use of consumers and may not be used for any purpose other than to identify prospective properties consumers may be interested in purchasing. Data last updated at September 18, 2026 12:00 AM