San Jose redrew its police map. Here's what changes for you
San Jose's first new police map in 25 years took effect Nov. 8, with 12 districts and nearest-unit dispatch. What changes, who gains most, and why staffing still sets the response clock.

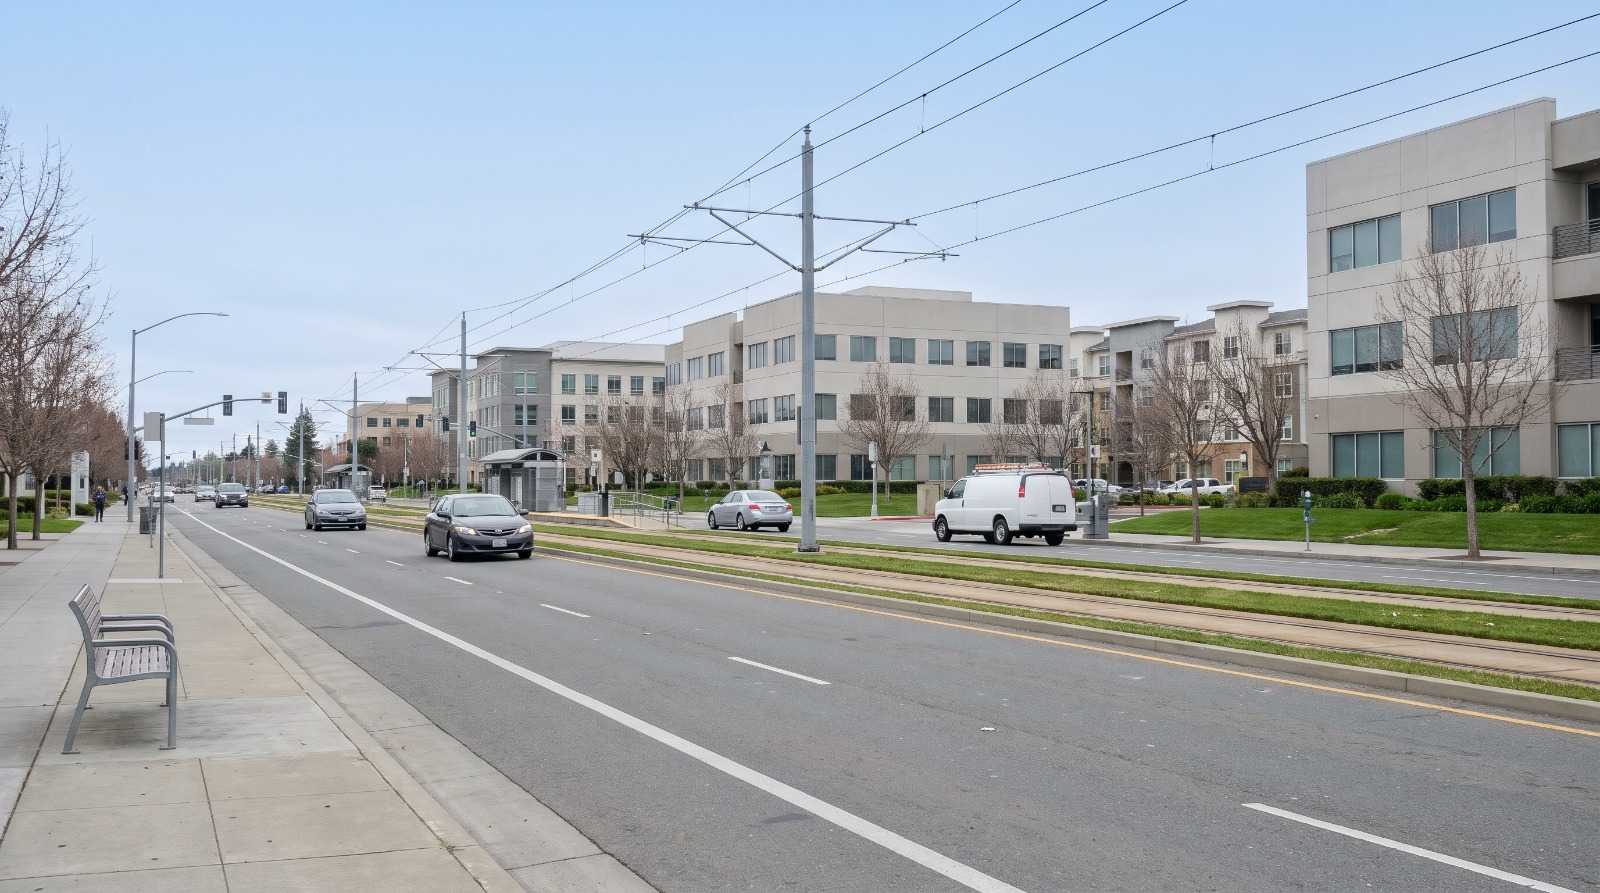
AI-rendered daytime view of North First Street in north San Jose with light rail tracks and office buildings Photo: Houseberry
On Sunday, Nov. 8, San Jose's police map changed for the first time in more than 25 years. The city went from 16 patrol districts to 12, and dispatchers stopped holding calls for the officer assigned to a specific beat. Now they send whoever is closest.
The department's pitch is speed. Its own audit numbers explain why. San Jose's average response to a Priority 1 call, the ones involving danger to life, was slightly more than eight minutes in the latest city audit, San José Spotlight reported in April. The target is six. Only 45 percent of those calls met it.
For a homeowner, the change is mostly invisible, and that is the point. Your address may now sit in a different, larger district, and the car that shows up may come from farther across it. According to Houseberry's San Jose rankings, 48 of the 112 San Jose neighborhoods we score rate 4.0 or better out of 5 on safety, and the median neighborhood scores 3.9. The new map is about the calls that still happen in all of them.
Fewer districts, because there are fewer officers
The old map was drawn for a bigger department. SJPD had nearly 1,400 officers on its active roster in 2008. At the start of 2025 it had 998, according to the city auditor's follow-up report, while overtime ran to $72 million in the year ending June 2025.
Sixteen districts split among that many officers left some districts thin. KTVU reported in February that districts averaged about four officers at a time, and that consolidation could roughly double that.
The department says it drew the new lines along major roads, natural features and long-standing neighborhood boundaries, and balanced them by call volume and severity. Some districts got bigger in area. Others shrank.
We think this is the right move. A department with 998 officers cannot staff a map drawn for 1,400, and holding a call for the beat officer while a free car sits two miles away was never defensible. The redesign does not add a single officer, though. It spreads the ones San Jose has more evenly, and response times will keep tracking the hiring numbers more than the map.
Who should notice a difference
The neighborhoods with the longest waits under the old map have the most to gain. North San Jose and Alviso had some of the city's slowest response times in 2023-24, according to KTVU, and Councilmember David Cohen, whose district covers that area, told the station response times there could drop by as much as four minutes.
That part of the city scores well on Houseberry's safety measure, which is built from reported crime, not response times. North San Jose scores 4.2 out of 5 for safety and Rincon de los Esteros scores 4.1. Their weak spot on our scale is amenities, at 2.7 and 2.4.
| Neighborhood | Houseberry safety score | Typical home, Oct. 2026 |
|---|---|---|
| Evergreen | 4.3 | About $2.0 million |
| North San Jose | 4.2 | About $1.47 million |
| Rincon de los Esteros | 4.1 | About $1.28 million |
| Willow Glen | 4.0 | About $2.2 million |
| Downtown San Jose | 1.3 | About $805,000 |
Downtown is the other end. Houseberry data for Downtown San Jose shows a safety score of 1.3, the lowest of the 112 neighborhoods we score. Fourteen San Jose neighborhoods score under 3.0. In those places, a free unit from the next beat over is a real gain when calls stack up.
A map cannot fix a staffing gap. The Priority 1 average has worsened since 2020, when it was about seven minutes, and the department is still well short of the 1,172 officer positions in its budget. If the new districts shave a minute or two citywide, that is a real improvement. Getting back under six minutes takes officers.
The number to check next is the city auditor's next response-time report, the first one that will cover a full year under the new map. Until then, see how your part of the city scores on Houseberry's San Jose safety ranking, then look up your address on the police department's district map.
Sources
- San Jose Police Department, patrol district redesign and interactive map
- Local News Matters, Faster responses seen in redrawn San Jose police districts taking effect Sunday, Nov. 7, 2026
- San José Spotlight, San Jose police overtime hit $72M in 2025, audit shows, April 28, 2026
- KTVU, SJPD consolidates patrol districts, Feb. 10, 2026
The Houseberry Research Team is Houseberry's reporting team: Bay Area real estate analysts, data specialists and longtime local market watchers. Every day we check the public record: building permits, city council and planning agendas, county recorder filings, state housing bills, police incident data and school results. Then we tie each story to what it means for specific neighborhoods, using Houseberry's own neighborhood data on prices, appreciation, safety, schools and amenities. Questions or corrections: Contact us.
Map of San Jose Neighborhoods
Loading map...
View Full Map
Top Neighborhoods in San Jose, CA


All information provided on this website including but not limited to - school ratings, safety, amenities, user opinions, and property data - is for general informational purposes only. We do not guarantee its reliability, accuracy, or completeness. Users should independently verify information and consult appropriate professionals as needed. By using this website, you agree Houseberry is not responsible for actions, decisions, or consequences arising from reliance on the information provided
houseberry.com - CA DRE# 01847391
 Bay East ©2025. CCAR ©2025. bridgeMLS ©2025. Information Deemed Reliable But Not Guaranteed. This information is being provided by the Bay East MLS, or CCAR MLS, or bridgeMLS. The listings presented here may or may not be listed by the Broker/Agent operating this website. This information is intended for the personal use of consumers and may not be used for any purpose other than to identify prospective properties consumers may be interested in purchasing. Data last updated at November 11, 2026 12:00 AM