How School Scores Move Bay Area Home Values (2026 Data)
Bay Area neighborhoods scoring 4.5 or higher for schools carry a $2.94M median price, nearly triple the sub-3.0 tier. How our state-data school score works, and the 11 high-score neighborhoods still priced below modeled value.
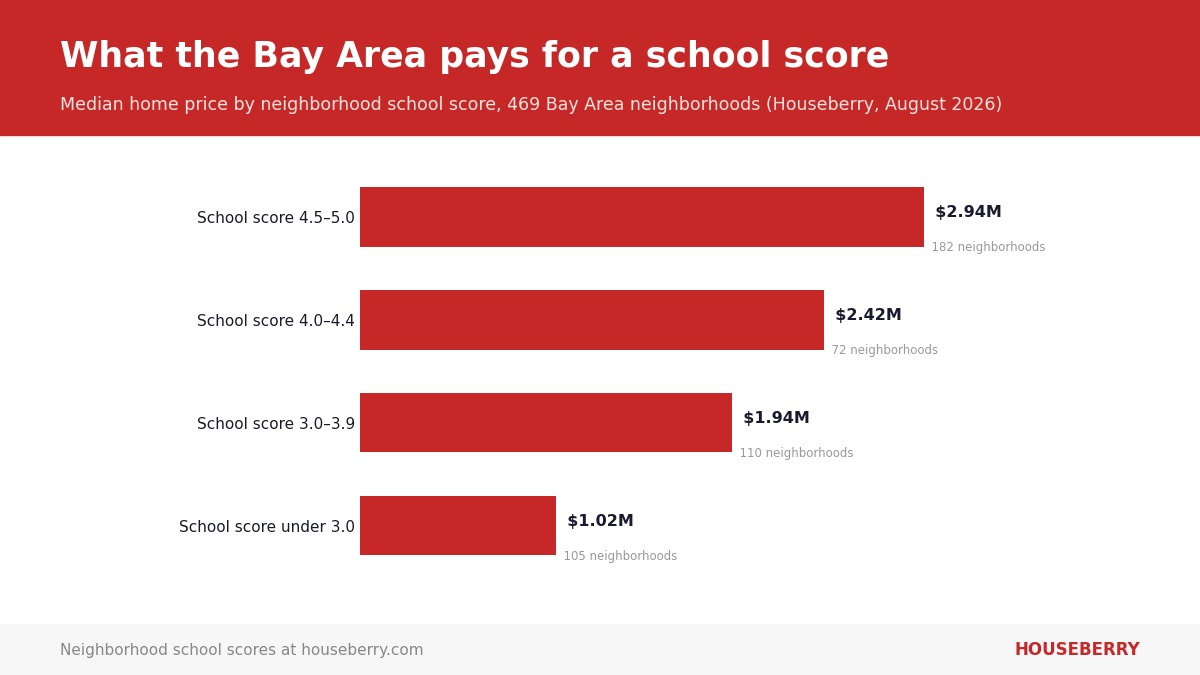
Chart of median Bay Area home prices by neighborhood school score, rising from $1.02M below a 3.0 score to $2.94M at 4.5 and up, per Houseberry data Photo: Houseberry
Bay Area neighborhoods with a school score of 4.5 or higher carry a median home price of $2.94 million. Where the score sits under 3.0, the median is $1.02 million. That is nearly a three to one gap, and buyers pay it on reputation far more often than on evidence. We built the Houseberry school score to replace the reputation with the State of California's own testing data, school by school, rolled up to the neighborhood you are actually buying into. Here is what the premium really buys, how the score works, and eleven places where the market has not caught up to the classrooms.
The school premium is real money
The chart above covers a 469-neighborhood sample spanning all five of our regional rankings, every entry with clean neighborhood-level pricing, as of August 2026. Median prices step up almost in lockstep with the score: $1.02 million under 3.0, $1.94 million from 3.0 to 3.9, $2.42 million from 4.0 to 4.4, and $2.94 million at 4.5 and above.
The lazy read is that school scores just proxy for rich areas. The data says otherwise. Hold safety constant and the premium survives. Among neighborhoods scoring 4.0 or higher for safety, the ones with school scores of 4.5 or better carry a $2.80 million median, against $1.80 million where the school score sits under 3.5. Same tier of quiet streets, a million dollars apart, and schools are the visible difference. The national research points the same way. A Brookings analysis found housing near high-scoring public schools costs about 2.4 times as much as housing near low-scoring ones. The Bay Area, on our numbers, runs hotter than that.
If you would rather see the whole board than a summary, the East Bay school ranking puts all 258 scored neighborhoods in one view.
Reputation is district folklore. Schools are the real unit.
The most expensive mistake in school-driven house hunting is buying the district instead of the school. Bay Farm Island in Alameda makes the point on a single island. The schools listed on its neighborhood page run from a 2.8 to a perfect 5.0, with Amelia Earhart Elementary at 4.8, the K-8 Bay Farm school at 5.0, Lincoln Middle at 4.2 and Alameda High at 4.5. One address, one district reputation, and a two-point spread depending on which doors a student actually walks through. The neighborhood's blended score lands at 4.6.
Rainbow, in west San Jose, makes the opposite point. The mailing address says San Jose, and San Jose's school reputation is a mixed bag. But Rainbow's serving schools sit in the Cupertino Union and Fremont Union orbits, and all four score 5.0. Buyers who filter by city name never see it.
Zoom out and the folklore gets worse. Region-average school scores run from 4.1 in Marin and 4.0 on the Peninsula to 3.7 in Silicon Valley, 3.2 in San Francisco and 2.8 in the East Bay, but averages hide everything useful. East Bay scores span 0.8 to 5.0, the widest range we track. And San Francisco, home of some of the most school-anxious buyers in America, does not have a single 5.0 neighborhood. The city's ceiling is 4.5, shared by Jordan Park / Laurel Heights and Outer Sunset. Across all 1,065 neighborhoods in our five regional rankings, only 69 hit a perfect score. That is one in fifteen.
How we build the score
We start where the folklore cannot follow: the California Department of Education's CAASPP research files, the raw statewide results of the Smarter Balanced assessments. For every public school we cover, we pull every tested grade-by-subject row, English language arts and math alike, and collapse them into a single measure of how that school's students actually performed on the state's tests.
Raw scale scores cannot be compared across grade levels, so we never mix them. Elementary, middle and high schools each run through their own separately calibrated statistical model, built across more than 1,200 Bay Area public schools, that converts a school's testing performance into the 5-point score you see on the site. Each school is then matched into our database by county and cleaned school name. When a school cannot be matched cleanly, it gets no score at all. We would rather show a blank than a guess.
The neighborhood score is the roll-up. It blends the scores of the elementary, middle and high schools serving that specific neighborhood, so the number reflects the full K-12 path from that address rather than a district average or the nearest famous campus. Every neighborhood page lists the individual schools with their own scores next to the blended number, so you can check our work. Scores were last updated in August 2026.
You can watch demand chase the score
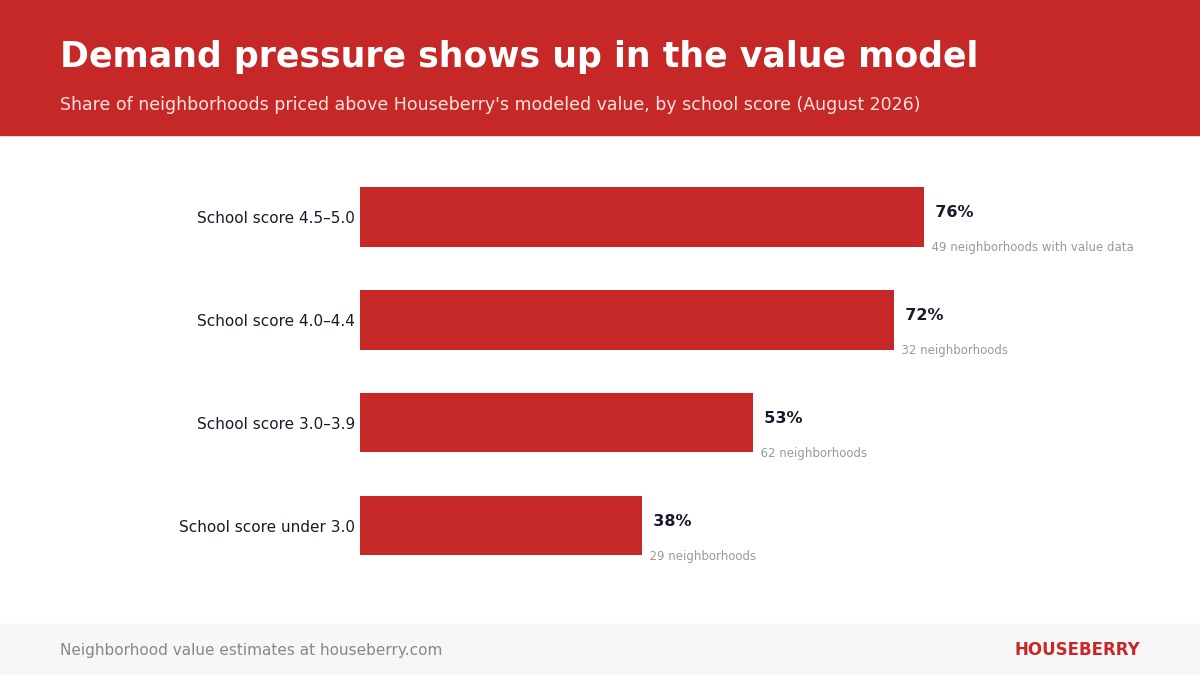
Our value model estimates what a neighborhood's homes should be worth from the fundamentals, then compares that with what the market is paying. Line those value gaps up against school scores and demand pressure appears in plain sight. Among the 172 neighborhoods in that sample with neighborhood-level value estimates, 76 percent of those scoring 4.5 or higher for schools trade above their modeled value. In the 4.0 to 4.4 band it is 72 percent. From 3.0 to 3.9 it drops to 53 percent, and under 3.0 it is 38 percent. Buyers systematically bid school neighborhoods past what the fundamentals alone would justify.
Mission San Jose in Fremont shows how sticky that bidding is. Its serving elementary schools both score 5.0, its median sits at $2.37 million, and it still trades $65,000 above modeled value in a year when its price cooled by about six percent. Demand for the score outruns the market itself.
Eleven neighborhoods where the price trails the classrooms
Flip the same screen around and you get the most useful list in this article: Bay Area neighborhoods scoring 4.5 or higher for schools that the market still prices below modeled value. As of August 2026 there are eleven with a gap of at least $20,000.
| Neighborhood | City | School score | Median price | Below modeled value |
|---|---|---|---|---|
| Strawberry Ln | San Jose | 4.6 | $3.22M | $271K |
| Bay Farm Island | Alameda | 4.6 | $1.36M | $211K |
| Prospect-Blaney | San Jose | 5.0 | $2.81M | $151K |
| Cipriani | Belmont | 4.9 | $2.39M | $147K |
| Lakes and Birds | Fremont | 5.0 | $1.49M | $137K |
| Ardenwood | Fremont | 5.0 | $1.69M | $124K |
| Union-Woodard | San Jose | 4.8 | $2.31M | $118K |
| Southside | Cupertino | 5.0 | $3.09M | $90K |
| Westside | Cupertino | 5.0 | $3.53M | $64K |
| Rainbow | San Jose | 5.0 | $3.24M | $54K |
| Redwood Shores | Redwood City | 5.0 | $2.69M | $33K |
Prices and value gaps are from our regional rankings as of August 2026, so treat them as a snapshot rather than a quote.
The Fremont pair deserves a hard look. Ardenwood and Lakes and Birds both run straight 5.0s at every level, with Ardenwood Elementary, Thornton Middle and American High all at 5.0, and both still price under $1.7 million, roughly half of what the famous 5.0 zones in Cupertino cost. Cipriani in Belmont pairs a 4.9 with Ralston Intermediate and Carlmont High at 5.0 and sits $147,000 under modeled value. Southside and Westside show even Cupertino has corners the market underprices. Undervalued is a screen, not a promise. But if you are going to pay the school premium anyway, this is the short list of places where you are not paying all of it. Redwood Shores closes the list with four serving schools at 4.9 or better and a modest $33,000 discount.
The catch, because there always is one
A high school score is not a momentum trade, and 2026 is proving it. This year's fastest price growth is happening in the catch-up tier, not the trophy tier. Among neighborhoods with a neighborhood-level appreciation figure, those scoring under 4.0 for schools posted a median gain of 11.3 percent, and 87 percent of them rose. The 4.0-and-up group managed a 3.2 percent median, with 62 percent rising. Mission San Jose's cooling is not an outlier.
There is a flip side worth naming. The catch-up tier also swings much harder, with year-over-year moves spread more than twice as widely as in high-score neighborhoods. Top school zones are where prices are already fully loaded and move in a narrower band. You buy them for durability, not for pop.
The score's own limits matter too. It measures tested academic performance and nothing else. It cannot see an exceptional music program, a strong special education team, or a campus culture that turns a struggling student around. Attendance boundaries shift and enrollment is never guaranteed by an address, so verify with the district before you write an offer.
Where this goes next
Watch enrollment. San Francisco is already closing schools, and it will not be the last district to redraw its map. Closures and boundary redraws will keep moving the map underneath district reputations, which is exactly the environment where a frozen reputation ages badly and a score rebuilt from each new round of state files does not. Our expectation, hedged the way any forecast should be, is that the undervalued eleven above close their gaps faster than the overvalued trophy zones grow into their premiums. No market moves in a straight line, but that is the direction the fundamentals lean.
How the neighborhood school score works
The numbers in this article come from Houseberry's scores across 1,065 neighborhoods in our five regional rankings, covering San Francisco, the Peninsula, Silicon Valley, the East Bay and Marin, on a 0 to 5 scale, alongside our median price, modeled value and appreciation figures, updated August 2026. The school score is our own model, built from the state's CAASPP testing files as described above, and every neighborhood page lists the underlying schools with their individual scores so the roll-up is checkable. The largest of the five rankings is the Silicon Valley school ranking, with 459 scored neighborhoods.
Questions buyers keep asking us
Do school scores really move home prices in the Bay Area?
Yes. Neighborhoods scoring 4.5 or higher for schools carry a $2.94 million median price against $1.02 million below a 3.0 score, and the gap survives between neighborhoods in the same safety tier, where the difference is still about a million dollars.
Which Bay Area neighborhoods have a perfect 5.0 school score?
Only 69 of the 1,065 neighborhoods in our regional rankings score 5.0, including Mission San Jose in Fremont, Westside in Cupertino and Ross in Marin. San Francisco has none. The city's top school score is 4.5, shared by Jordan Park / Laurel Heights and Outer Sunset.
Which high-scoring school neighborhoods are undervalued in 2026?
Eleven neighborhoods pair a school score of 4.5 or higher with a price at least $20,000 below our modeled value, led by Strawberry Ln in San Jose at $271,000 under, Bay Farm Island in Alameda at $211,000 under and Cipriani in Belmont at $147,000 under.
Is a high school score a guarantee of appreciation?
No. Over the past year the fastest gains sat in neighborhoods scoring under 4.0 for schools, which posted an 11.3 percent median rise against 3.2 percent for the 4.0-and-up group. High-score neighborhoods move in a narrower band, the profile of a hold rather than a sprint.
The way to use all of this is simple. Decide what the schools are worth to you before the open house decides it for you. Then open the Peninsula school ranking or the ranking for your side of the Bay, pull up the neighborhoods you are considering, and read the school list on each page the way you would read an inspection report. The premium is real. Make sure the classrooms behind it are too.
All information provided on this website including but not limited to - school ratings, safety, amenities, user opinions, and property data - is for general informational purposes only. We do not guarantee its reliability, accuracy, or completeness. Users should independently verify information and consult appropriate professionals as needed. By using this website, you agree Houseberry is not responsible for actions, decisions, or consequences arising from reliance on the information provided
houseberry.com - CA DRE# 01847391
 Bay East ©2025. CCAR ©2025. bridgeMLS ©2025. Information Deemed Reliable But Not Guaranteed. This information is being provided by the Bay East MLS, or CCAR MLS, or bridgeMLS. The listings presented here may or may not be listed by the Broker/Agent operating this website. This information is intended for the personal use of consumers and may not be used for any purpose other than to identify prospective properties consumers may be interested in purchasing. Data last updated at October 1, 2026 12:00 AM