Bay Area Millennial Homeownership Is Still Near the Bottom
Bay Area millennial homeownership grew 88 percent since 2018, and the number is being read backwards. In percentage points the rest of the country gained more ground than we did.

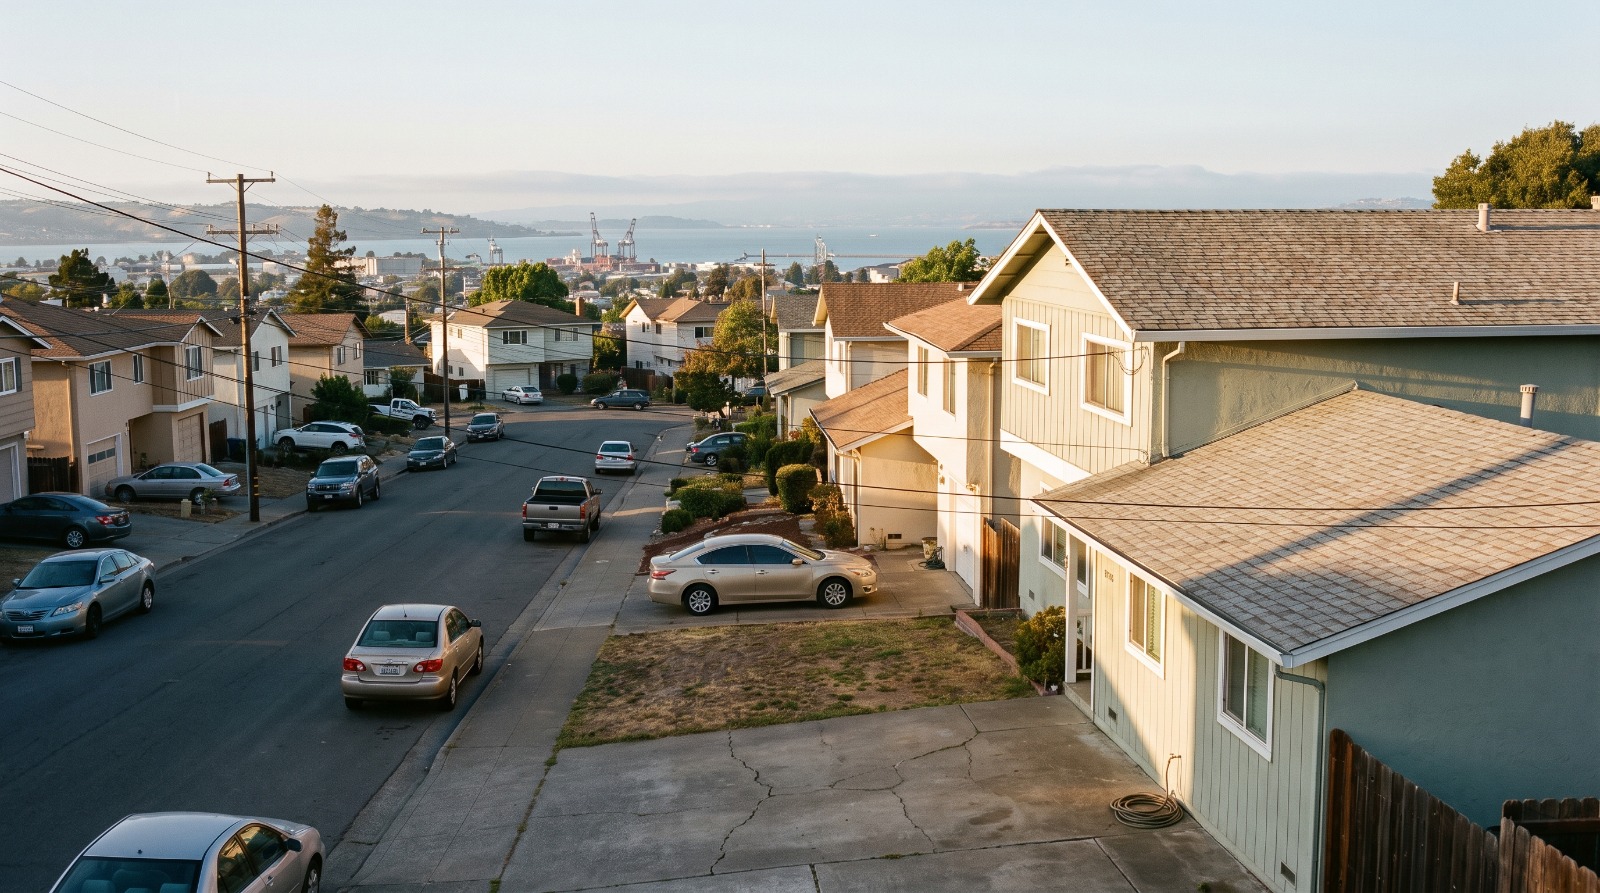
Hillside street of modest single-family homes in Vallejo at golden hour, looking west toward the Carquinez Strait, the affordable end of Bay Area millennial homeownership. Photo: Houseberry
Bay Area millennial homeownership grew 88 percent between 2018 and 2023, and that number is being read exactly backwards. Measured in percentage points, which is how homeownership is normally measured, the rest of the country gained more ground than we did. The San Francisco metro went from about 26 percent of millennial households owning to 37.6 percent. The nation went from roughly 37 percent to roughly 50 percent. We grew faster because we started near the bottom, and we are still near the bottom.
The gain, in points: San Francisco metro plus 11.4, the United States plus 12.3. The growth rate reverses the actual ranking.
Where the Bay Area landed in 2023 is roughly where the whole country stood in 2018. That is a five-year lag, not a lead.
A real share of the gain left town. Bay Area residents who moved away became meaningfully more likely to own, in neighborhoods with median incomes 23 percent lower.
The arithmetic that flips the headline
The study behind this week's coverage is RentCafe's July 15, 2026 analysis of IPUMS census microdata, covering the 107 metro areas with at least 50,000 millennial households. It counts households rather than individuals, and it defines millennials the way Pew does, born 1981 through 1996.
RentCafe publishes two things for each metro: the 2023 homeownership rate, and the growth in the number of millennial owner households since 2018. It does not publish the 2018 rate. That is the number that changes the story, and it is sitting inside the household counts the study does publish.
San Francisco metro: 103,353 millennial owner households in 2018 and 193,905 in 2023, against 290,529 renter households in 2018 and 321,244 in 2023. Do the division and 2018 comes out at 26.2 percent.
| Millennial homeownership rate | 2018 | 2023 | Change |
|---|---|---|---|
| San Francisco metro | 26.2 percent | 37.6 percent | plus 11.4 points |
| San Jose metro | 25.9 percent | 34.2 percent | plus 8.3 points |
| United States | about 37.4 percent | about 49.7 percent | plus 12.3 points |
The 2023 metro rates are RentCafe's own published figures. The 2018 rates and both national figures are our arithmetic on the household counts RentCafe published, and the method reproduces their 2023 rates to the decimal. Nationally that is 7.13 million owner households against 11.95 million renter households in 2018, and 12.41 million against 12.57 million in 2023.
A growth rate is a fraction with the starting point in the denominator. Start small enough and any real improvement looks enormous. Ours did.
San Jose is the clean proof
San Jose metro millennial owner households grew 74.1 percent. The national figure was 74 percent. Identical headline. But San Jose's rate moved 8.3 points against the nation's 12.3, entirely because it started at 25.9 percent instead of 37.4.
One sentence version: San Jose matched America's growth rate and fell further behind America.
One methodology note, because it matters here
You will see a national millennial homeownership figure of 55.4 percent circulating from Redfin's January 2026 analysis. Do not set it next to the 37.6. Redfin counts individuals, RentCafe counts households, and one owned home covers a couple. The defensible comparison is 37.6 against roughly 50, both out of RentCafe's own numbers. That is still a 12-point gap. It is just not the 18-point gap the mismatched version produces.
A real share of that growth walked out the door
RentCafe's own California leaderboard says it plainly. Stockton posted 117.6 percent growth in millennial owner households, Oxnard 113.9, Fresno 104. The study credits the state's gains to millennials finding "affordable oases, like Stockton and Fresno, where housing costs are below the state average."
The California Policy Lab put credit data behind that. Its July 30, 2026 study Priced Out of the Bay followed Bay Area residents through anonymized credit records from 2014 to 2025. People who left were one third less likely to own a home before they left. Within five years of moving, they were 9 percentage points more likely to own.
They bought those odds with location. Out-of-state movers landed in neighborhoods with median incomes $17,300 lower, home values 57 percent lower, and 4 to 8 percent fewer students proficient in math and English. Among Bay Area movers aged 18 to 25, the share leaving California entirely rose from 14 percent in 2014 to 23 percent in 2025.
So part of the Bay Area's millennial homeownership gain is measured on people who became former Bay Area residents first.
What a normal income actually reaches here
The California Association of Realtors published its second quarter 2026 affordability numbers on August 5. Statewide, 19 percent of households could afford the $916,750 median home, which required $228,400 a year at a 6.54 percent effective rate.
County by county the region runs worse. San Francisco needs $535,600 to qualify against a $2.15 million median, and 18 percent of households clear it. Santa Clara needs $510,800 at a $2.05 million median. Alameda needs $336,400. Contra Costa needs $229,200. Solano, the cheapest county in the region, needs $146,800 against a $590,000 median, and a third of households make it.
For scale, the National Association of Realtors reported in November 2025 that the median first-time buyer in the United States is now 40 years old, and first-time buyers made up 21 percent of the market, the lowest share since the survey began in 1981. The typical first-time buyer in this country is not a 28-year-old with a signing bonus. She is 40, and Solano's number is still a reach.
The bottom rung, in our own numbers
Here is what the affordable end of the region looks like when you set price next to how the neighborhoods actually score. These are current medians taken from each city's 12-month price history in July 2026, not year-old snapshots.
| City | Median price, July 2026 | Overall score | Schools | Safety |
|---|---|---|---|---|
| Vallejo | $544,870 | 2.2 | 2.2 | 2.1 |
| Pittsburg | $578,650 | 2.2 | 1.8 | 2.8 |
| Antioch | $603,780 | 2.4 | 2.0 | 2.8 |
| Richmond | $662,000 | 2.3 | 2.1 | 2.6 |
| Concord | $824,630 | 2.8 | 2.5 | 3.4 |
| Hayward | $935,430 | 3.0 | 2.5 | 3.3 |
The pattern is not subtle. Every step down in price is a step down in the score, and the schools column falls fastest of all. Vallejo's median of about $544,900 is the lowest of any Bay Area city we score, and the city carries a 2.2 overall with a 2.2 for schools. Concord costs $280,000 more and buys 0.6 of a point. You can see the whole ladder on our East Bay neighborhoods ranked by price page.
That trade is what the 88 percent is made of: buying further out and lower down.
The move that is actually available
Here is the part city averages hide, and it is the reason we built Houseberry around neighborhoods instead of cities.
A city score is an average of very different places. Somerset Highlands, the hillside pocket on Vallejo's east side, had a median of about $608,800 in July 2026 and scores 3.2 overall with a 4.0 for safety, inside a city that scores 2.2. Carriage Hills North ranks first of Richmond's 32 neighborhoods at 3.8 overall and a 5.0 for safety, at about $746,050.
Both are reachable for a household that cannot get near Alameda County, let alone San Mateo.
And both carry the same catch. Somerset Highlands rates 0.6 out of 5 for walkable merchants. Carriage Hills North has no corner store or coffee shop you can walk to. What this rung of the market buys is a quiet, safe, drive-to-everything address. If you want to walk for coffee on a Saturday, it is mostly not on offer at this price, and pretending otherwise is how people end up unhappy 18 months after closing.
So where does Bay Area millennial homeownership actually stand
It does not mean Bay Area millennials are doing badly. Adding roughly 90,000 owner households in five years is real money and real keys, and the people who did it are not a rounding error.
It does mean the growth rate is the wrong statistic to celebrate, because the metric rewards having started near the bottom. It means a meaningful slice of the improvement is measured on households that left. And it means the useful question for anyone still trying is not whether millennials are buying. It is which specific neighborhood clears your number and still scores well on the two or three things you actually care about, which is a question about a few dozen addresses rather than a generation.
The 88 percent will get quoted for months. When it comes up, ask what the 2018 number was. That is where the story lives.
Sources
- RentCafe, Top Metro Areas for Millennial Homeowners and Renters, July 15, 2026: rentcafe.com
- California Policy Lab, Priced Out of the Bay, July 30, 2026: capolicylab.org
- California Association of Realtors, Q2 2026 Housing Affordability Index, August 5, 2026: car.org
- National Association of Realtors, 2025 Profile of Home Buyers and Sellers, November 4, 2025: nar.realtor
- Redfin, Homeownership Rate by Generation, January 2026: redfin.com
- Almanac News, Bay Area millennials are buying homes faster than the nation, August 11, 2026: almanacnews.com
- Houseberry city and neighborhood price histories and scores, retrieved August 18, 2026.
The Houseberry Research Team is Houseberry's reporting team: Bay Area real estate analysts, data specialists and longtime local market watchers. Every day we check the public record: building permits, city council and planning agendas, county recorder filings, state housing bills, police incident data and school results. Then we tie each story to what it means for specific neighborhoods, using Houseberry's own neighborhood data on prices, appreciation, safety, schools and amenities. Questions or corrections: Contact us.
All information provided on this website including but not limited to - school ratings, safety, amenities, user opinions, and property data - is for general informational purposes only. We do not guarantee its reliability, accuracy, or completeness. Users should independently verify information and consult appropriate professionals as needed. By using this website, you agree Houseberry is not responsible for actions, decisions, or consequences arising from reliance on the information provided
houseberry.com - CA DRE# 01847391
 Bay East ©2025. CCAR ©2025. bridgeMLS ©2025. Information Deemed Reliable But Not Guaranteed. This information is being provided by the Bay East MLS, or CCAR MLS, or bridgeMLS. The listings presented here may or may not be listed by the Broker/Agent operating this website. This information is intended for the personal use of consumers and may not be used for any purpose other than to identify prospective properties consumers may be interested in purchasing. Data last updated at October 23, 2026 12:00 AM