Bay Area's Two-Speed Market: SF Soars, South Bay Cools
San Francisco homes are selling $1M over asking while Santa Clara County prices fall. Inside the Bay Area's two-speed 2026 housing market, and where buyers still find room.

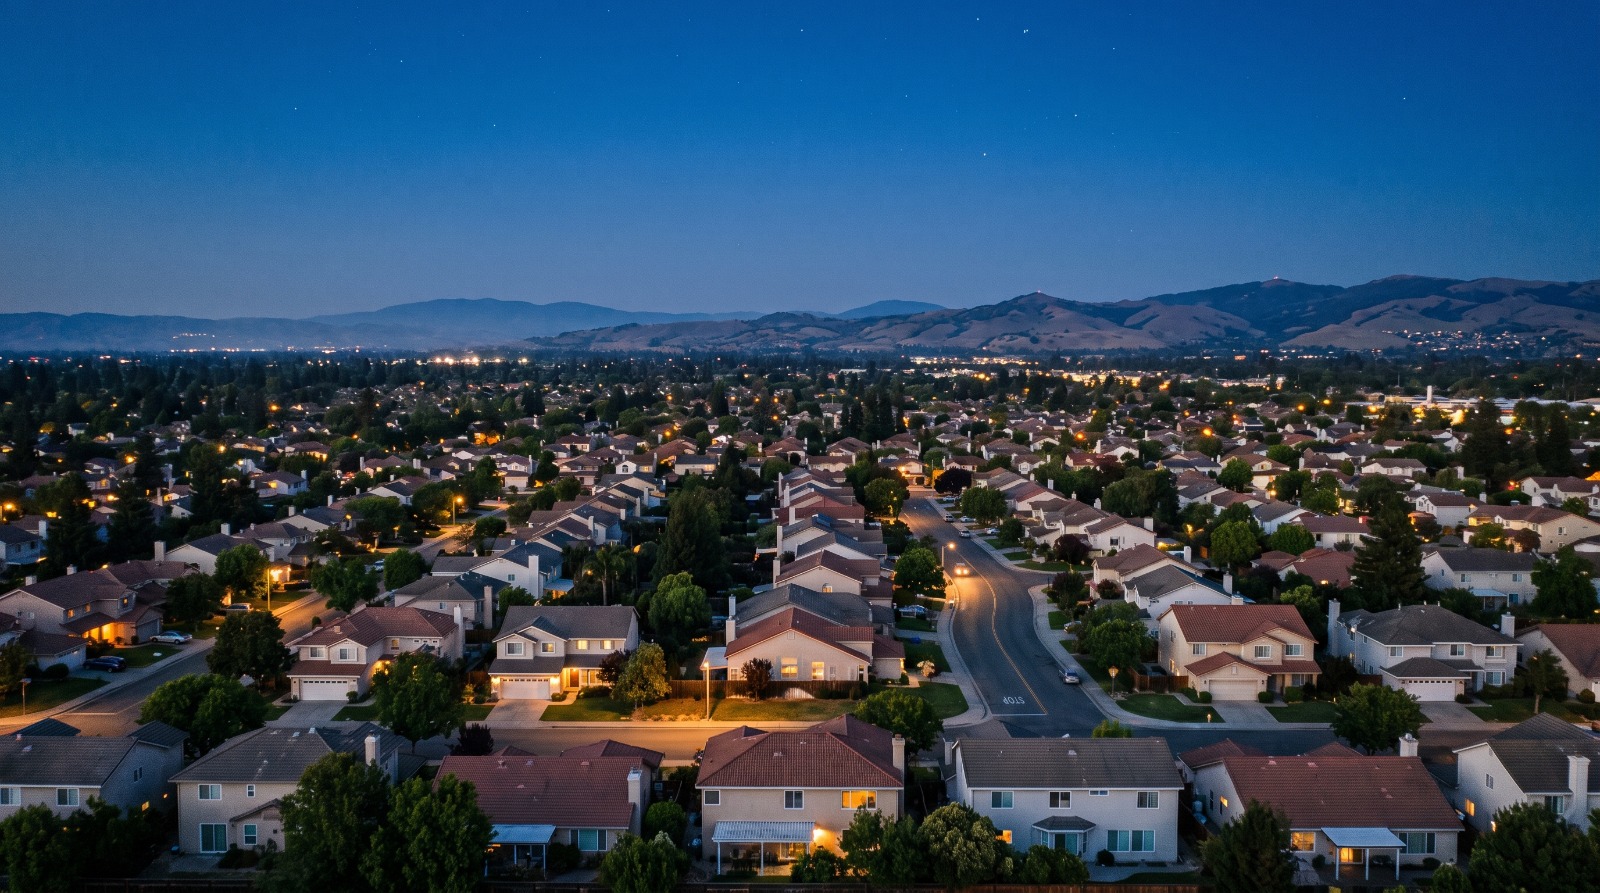
A twilight view across a South Bay single-family neighborhood toward the foothills, illustrating the Bay Area's two-speed 2026 housing market. Photo: Houseberry
Forty-four. That is how many San Francisco homes sold at least $1 million over their asking price in June 2026, together clearing more than $60 million above list, according to Compass data. Two years ago, the city went entire months without a single sale like that. Drive an hour south and the story flips. In Santa Clara County, the heart of Silicon Valley, home prices are falling. One Bay Area, two housing markets, moving in opposite directions at the same time.
The split, in one table
The clearest way to see the two-speed market is to line the numbers up. These are June 2026 figures.
| June 2026 | Median sale price | Year over year | Days on market |
|---|---|---|---|
| San Francisco, single-family | about $2.2M | up 22.6% | 12 |
| Santa Clara County, single-family | about $1.92M | down 8.6% | 12 |
| Santa Clara County, condos | about $662K | down 11.8% | 31 |
San Francisco single-family homes are up more than 22% in a year and selling in under two weeks, about 25% over asking on average. Santa Clara County single-family homes are down almost 9%, and its condo market is off nearly 12% with listings now sitting more than a month. Same region. Opposite directions.
What is fueling San Francisco
The San Francisco surge has a specific engine, and it is not the whole city rising evenly. It is a wave of tech equity turning liquid. Employees at OpenAI, Anthropic, and Databricks are racing to buy before IPO and lockup deadlines let them cash out shares, and the $1-million-over-asking sales have jumped roughly 1,700% from a year ago, from 8 in the first half of 2025 to 144 in the first half of 2026.
The bidding is concentrated, too. A large share of June's blowout sales clustered in one zip code, 94114, the Noe Valley and Dolores Heights area, per the Compass analysis. So if you assumed the frenzy meant deals had dried up everywhere, the opposite is closer to true. The hottest pockets are getting hotter, and the same AI money is now spilling into offices down the Peninsula too.
What is cooling the South Bay
The South Bay is telling the other half of the story. Santa Clara County's single-family median slipped to about $1.92 million in June, down 8.6% year over year, and the condo segment softened harder, down almost 12% with days on market up more than 40%.
The driver is jobs. Tech layoffs are running high nationally, with more than 139,000 tech-sector cuts in the first half of 2026, up 83% from a year earlier as companies restructure around AI. Locally, Santa Clara County has seen thousands of positions flagged for cuts in state layoff filings. When the county whose economy is tech starts shedding tech jobs, the froth comes off first in the condo tiers and the outer neighborhoods, which is exactly where the numbers are bending now.
One correction worth making, because it changes how you read the market. The South Bay softening is showing up mostly in falling prices and a condo glut, not in a flood of new single-family listings. Single-family supply is actually tighter than a year ago. So this is prices rolling over under job uncertainty, not a wave of sellers rushing the exits.
Where buyers actually get more room
If you are a buyer, the two-speed market is not bad news. It just tells you where to look. And the room is not in Noe Valley, which is the frenzy, not the discount. It is in two other places.
The first is the South Bay itself, where softer prices and a slower condo market mean less competition than a year ago, especially for condos and townhomes. The second is the East Bay. Oakland's typical home still sells for around $740,000, roughly half of San Francisco's number, and a rising share of Oakland listings are taking price cuts, which hands buyers a little negotiating leverage they will not find across the bay. Even a strong Oakland pocket like Rockridge, where homes still move fast, prices well below the SF median.
This is the neighborhood-first habit we built Houseberry on. The regional headline tells you almost nothing about a specific block. What helps is comparing the actual places, so it is worth seeing how San Francisco neighborhoods rank, where the value is in San Jose, and how Oakland compares before deciding which market you are actually shopping in.
What this does and does not mean
A two-speed market is easy to over-read, so here is the sober version.
It does mean the Bay Area no longer moves as one. A single number for the regional market now hides more than it shows, because San Francisco and Santa Clara County are pulling apart. It does mean AI wealth is real and concentrated, and it is reshaping the top of the SF market fast.
It does not mean San Francisco is unaffordable everywhere and the South Bay is suddenly cheap. SF condos are up only modestly, not 22%, and Santa Clara County's median still sits near $1.9 million. It does not mean the South Bay is crashing either. Falling prices after a long run, with tight single-family supply, look more like a cooldown than a collapse. And it does not mean you should try to time it. The useful move is not guessing the bottom. It is knowing which of the two markets your target neighborhood actually sits in, and shopping accordingly. We broke down the SF side of this in more detail in our look at how far over asking SF homes are going in 2026.
The two-speed market, answered
Is now a good time to buy in the Bay Area?
It depends which market you mean. The South Bay and East Bay give buyers more room right now, while San Francisco's top tier is intensely competitive. There is no single answer, which is the whole point. Match your budget to the market that fits it, and this is context rather than personalized advice.
Why are San Francisco prices rising while the South Bay falls?
Different engines. SF is riding concentrated AI and IPO wealth as tech employees cash out equity, while Santa Clara County is absorbing the drag from tech layoffs, which pulls its prices and its condo market down.
Is the South Bay housing market crashing?
No. Single-family prices are down about 9% year over year and condos nearly 12%, but single-family inventory is tight, so this reads as a cooldown after a long run, not a crash.
Where can buyers still find value?
South Bay condos and townhomes, where competition has eased, and the East Bay, where Oakland runs roughly half of San Francisco's price. Comparing neighborhoods directly, rather than trusting the regional headline, is the way to find the specific pockets that pencil out.
Sources
- Fox Business, some Bay Area homes selling $1M above asking
- The Real Deal, SF homes sell $1M over asking as office boom flows south
- SF Standard, SF hyper-bidding home sales
- Lurie Group, San Francisco June 2026 real estate report
- Ascendre, Silicon Bay market update, July 2026
- HR Dive, tech layoffs surge 83% in H1 2026 (Challenger)
- JVM Lending, Oakland real estate market report
The Houseberry Research Team is Houseberry's reporting team: Bay Area real estate analysts, data specialists and longtime local market watchers. Every day we check the public record: building permits, city council and planning agendas, county recorder filings, state housing bills, police incident data and school results. Then we tie each story to what it means for specific neighborhoods, using Houseberry's own neighborhood data on prices, appreciation, safety, schools and amenities. Questions or corrections: Contact us.
All information provided on this website including but not limited to - school ratings, safety, amenities, user opinions, and property data - is for general informational purposes only. We do not guarantee its reliability, accuracy, or completeness. Users should independently verify information and consult appropriate professionals as needed. By using this website, you agree Houseberry is not responsible for actions, decisions, or consequences arising from reliance on the information provided
houseberry.com - CA DRE# 01847391
 Bay East ©2025. CCAR ©2025. bridgeMLS ©2025. Information Deemed Reliable But Not Guaranteed. This information is being provided by the Bay East MLS, or CCAR MLS, or bridgeMLS. The listings presented here may or may not be listed by the Broker/Agent operating this website. This information is intended for the personal use of consumers and may not be used for any purpose other than to identify prospective properties consumers may be interested in purchasing. Data last updated at October 21, 2026 12:00 AM