Bay Area homes sell fastest in 12 neighborhoods. Few are cheap
We measured listing-to-closing time for 877 Bay Area neighborhoods. Twelve close in 26 days or less, ten of them in San Francisco, and none costs under $1.8 million.

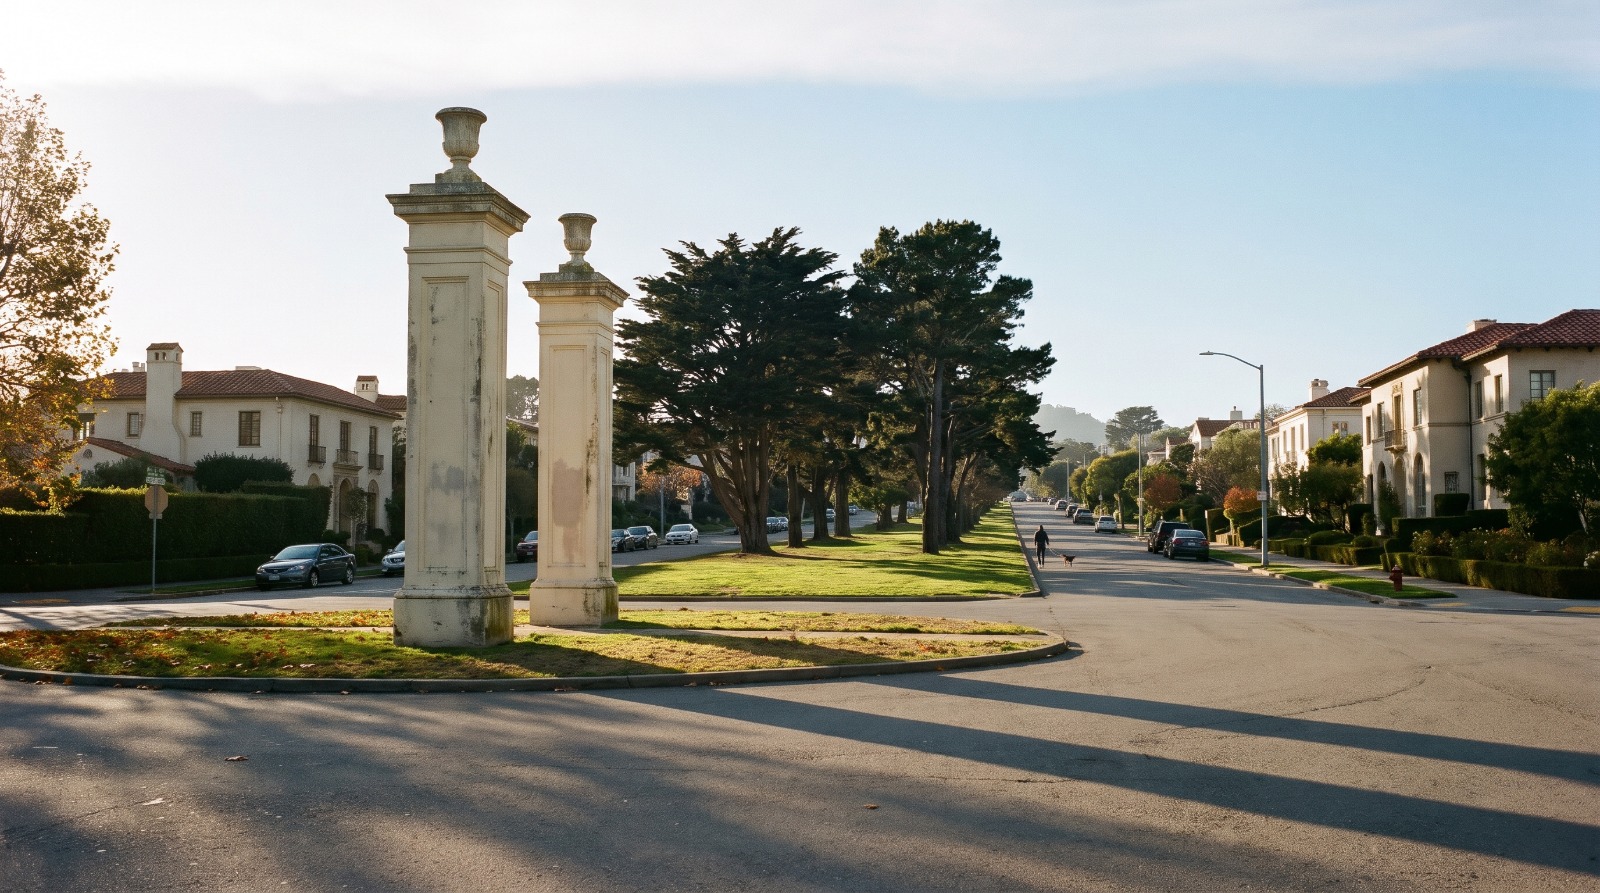
The St. Francis Wood entrance pillars at St. Francis Circle in San Francisco, looking up St. Francis Boulevard at golden hour Photo: Houseberry
A house in Forest Hills Extension, on San Francisco's west side, typically went from listing to closing in 22 days over the past year. That is the fastest pace of 877 Bay Area neighborhoods Houseberry tracked with MLS sales data, and it includes escrow. The typical home there costs about $2.63 million, according to Houseberry's Forest Hills Extension page.
Twelve neighborhoods close their typical sale in 26 days or less. Ten are in San Francisco. Two are on the Peninsula. None costs under $1.8 million.
That last fact is the story. In the Bay Area right now, expensive homes move faster than cheap ones, and by a wide margin.
How we measured it
Days on market here means the days from a home's first listing date to its closing date, the median for every house, townhouse and condo that closed in the 12 months to October 4, 2026. It comes from Houseberry's monthly price run over three MLS feeds covering San Francisco, San Mateo, Santa Clara, Alameda and Contra Costa counties.
Because it runs to closing, our number is longer than the "days on market" you see on listing sites, which stop the clock at an accepted offer. Redfin put San Francisco's median at 38 days to contract in January, as Stacker reported. A San Francisco house averaged about 12 days on market in May, by theFrontSteps' count. A financed escrow commonly runs about a month. So when a neighborhood's listing-to-closing median is 22 days, many of its sellers accepted an offer within a week and closed quickly, often with cash.
We left out any neighborhood with fewer than 8 sales in the 12 months, because a median of five sales can swing 20 days on one slow listing. That leaves 877 neighborhoods. We then pulled closed sales again on October 28 and recomputed the leaders from scratch. Every neighborhood on the list below landed within two days of its October figure.
Two that would have made it did not hold up: Summerhill in Los Altos slipped from 26 days to about 30, and Garfield in Albany fell to 5 sales in the newer window.
Fewer than 3 percent of all sales we checked closed within 10 days of listing, the pattern you get from off-market deals entered after the fact, and removing them moves no median on the list by more than a day.
The 12 fastest-selling Bay Area neighborhoods
1. Forest Hills Extension, San Francisco: 22 days, about $2.63M
2. Jordan Park / Laurel Heights, San Francisco: 22 days, about $3.11M
3. Sea Cliff, San Francisco: 24 days, about $5.57M
4. North Panhandle, San Francisco: 25 days, about $1.84M
5. Saint Francis Wood, San Francisco: 25 days, about $3.83M
6. Lake Street, San Francisco: 25 days, about $3.63M
7. Monterey Heights, San Francisco: 25 days, about $3.04M
8. Hillsborough Oaksbridge, Hillsborough: 25 days, about $6.22M
9. Westwood Highlands, San Francisco: 26 days, about $2.60M
10. Ray Park, Burlingame: 26 days, about $3.69M
11. Ingleside Terrace, San Francisco: 26 days, about $2.49M
12. Forest Hill, San Francisco: 26 days, about $2.96M
Ties are ordered by the number of sales behind the figure, most first. Prices are Houseberry's typical home price as shown on each neighborhood page in late October 2026.
| Neighborhood | Days to close | Sales in 12 months | Typical price |
|---|---|---|---|
| Forest Hills Extension | 22 | 15 | $2.63M |
| Jordan Park / Laurel Heights | 22 | 12 | $3.11M |
| Sea Cliff | 24 | 11 | $5.57M |
| North Panhandle | 25 | 45 | $1.84M |
| Saint Francis Wood | 25 | 19 | $3.83M |
| Lake Street | 25 | 19 | $3.63M |
| Monterey Heights | 25 | 12 | $3.04M |
| Hillsborough Oaksbridge | 25 | 11 | $6.22M |
| Westwood Highlands | 26 | 13 | $2.60M |
| Ray Park | 26 | 11 | $3.69M |
| Ingleside Terrace | 26 | 10 | $2.49M |
| Forest Hill | 26 | 9 | $2.96M |
The median typical price on this list is about $3.08 million. San Francisco's citywide typical price is about $1.65 million, on Houseberry's San Francisco ranking.
West of Twin Peaks is where the clock runs shortest
Six of the twelve sit in the cluster of 1910s and 1920s residence parks on the slopes west of Twin Peaks and around Mount Davidson: Forest Hills Extension, Saint Francis Wood, Monterey Heights, Forest Hill, Ingleside Terrace and Westwood Highlands. Most of the housing is detached single-family homes on curving streets laid out in the 1910s, with Muni Metro along the edges.
Supply explains most of it. Saint Francis Wood, laid out by the Olmsted Brothers in 1912, had about 1,229 residents in 2019 and recorded 19 sales in the past year. When one of those houses comes up, the buyers who have been waiting for that street are already there. Forest Hill closed 9 sales. A neighborhood that small cannot build up the backlog of stale listings that drags a median out.
The trade-off is fog. These slopes sit in the marine layer for much of the summer, and the houses are older and often need work. Buyers are paying, and paying fast, for detached houses inside the city limits, not for weather.
The north side: Jordan Park, Lake Street, Sea Cliff
Jordan Park / Laurel Heights ties for first at 22 days, and its typical home costs about $3.11 million. Lake Street and Sea Cliff follow at 25 and 24 days. Sea Cliff is the most expensive neighborhood on the list after Hillsborough, at about $5.57 million, and still closed its typical sale in under four weeks.
That runs against the usual rule that the top of the market is slow. In San Francisco this year it was not. Over $4 million, Bay Area neighborhoods posted a median of about 35 days, the same as the $1.5 million to $4 million bands.
North Panhandle is the most reliable number on the list
North Panhandle closed 45 sales in the year, three times as many as most of the twelve, and still came in at 25 days. It is also the least expensive neighborhood on the list, at about $1.84 million, and the most urban, with flats and condos in older buildings mixed in among the houses.
If you want one figure that is not riding on a dozen transactions, this is it. North Panhandle sits between Golden Gate Park's Panhandle and the USF campus, with the 5 Fulton and the Divisadero corridor at its edges.
Two on the Peninsula, both expensive
Hillsborough Oaksbridge is the priciest neighborhood on the list at about $6.22 million and closed in 25 days on 11 sales. Ray Park in Burlingame closed in 26 days at about $3.69 million.
San Mateo County as a whole runs slower. The county's median across all sales was 38 days, and only 7 of its 137 measured neighborhoods were under 30.
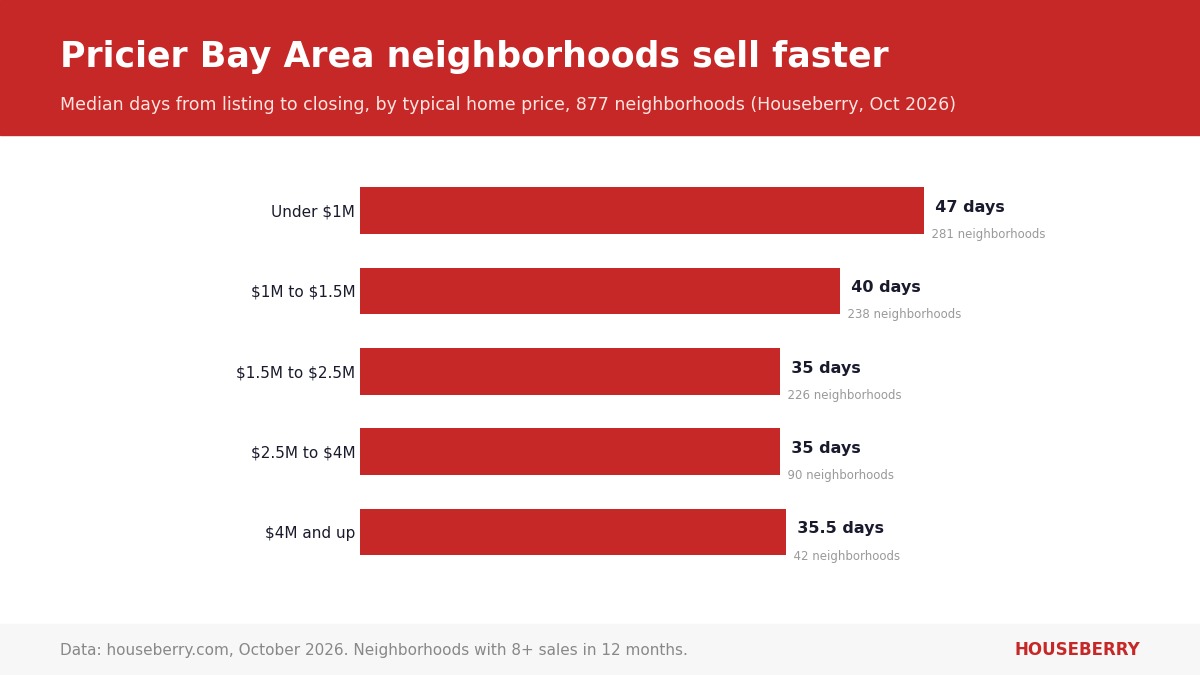
Cheaper neighborhoods take longer, by about 12 days
Sort the 877 neighborhoods by typical price and the pattern is plain. The 281 neighborhoods under $1 million have a median of 47 days from listing to closing. Between $1 million and $1.5 million, 40 days. From $1.5 million up, about 35, flat all the way to the top.
Only one neighborhood under $1 million made it under 30 days: City Center in El Cerrito, at 29 days on 9 sales and about $811,000. Three more sell in 28 days at under $1.5 million: Greenville North in Livermore at about $1.02 million, North Beach in San Francisco at about $1.33 million, and Colusa Ave in El Cerrito at about $1.37 million.
We read the gap as a financing story more than a demand story. Lower-priced homes draw more buyers using FHA, VA and conventional loans with low down payments, and those escrows run longer, with appraisals, inspections and lender conditions. A cash buyer in Sea Cliff can close in two weeks. Condos, which make up more of the sales in cheaper neighborhoods, add HOA document reviews. Part of the 12-day gap is the paperwork, and part is that sellers in those neighborhoods face more competing listings.
What 25 days versus 45 days means for an offer
If you are buying in a 25-day neighborhood, assume the house you like will have an offer date within a week of listing, and get your loan approval and inspection review done before you tour. Contingencies are a hard sell where the median seller closes in three weeks.
In a 45-day neighborhood, you usually have time to ask for an inspection contingency and to negotiate after the first weekend. That is about the escrow and the pool of listings, not a judgment on the neighborhood.
For sellers, the same numbers set expectations. A listing in a 45-day neighborhood that has not drawn an offer by week three is behaving normally.
County by county
San Francisco is the fast county by any cut: 33 days across all sales, and 25 of its 79 measured neighborhoods under 30 days, about one in three. San Mateo was 38 days, Santa Clara 39, Alameda 40 and Contra Costa 43. Outside San Francisco, roughly one neighborhood in twenty clears 30 days.
Questions buyers ask
Is days on market the same as days to sell? Listing sites usually count days to an accepted offer. Ours counts to closing, which is the date the seller actually has the money. Expect our figures to run two to four weeks longer than a listing site's.
Why not include neighborhoods with only a few sales? A neighborhood with four sales can show a 15-day median one month and 60 the next. Eight sales in 12 months is the floor we used.
Does a fast neighborhood mean prices are rising? Not by itself. Jordan Park's typical price is up about 0.6 percent in 12 months on its Houseberry page, while Monterey Heights is up about 21.8 percent. Both close in under four weeks.
Before you write an offer, check how your target neighborhood scores on schools, safety and price on Houseberry's San Francisco neighborhood rankings, and how fast the streets around it are moving on the Houseberry map.
Sources
- Houseberry neighborhood price and days-on-market data, MLS closed sales in five Bay Area counties, 12 months to October 4, 2026, rechecked October 28, 2026
- Stacker, citing Redfin: How long does it take to sell a house in San Francisco in 2026?
- theFrontSteps: San Francisco real estate update, June 2026
The Houseberry Research Team is Houseberry's reporting team: Bay Area real estate analysts, data specialists and longtime local market watchers. Every day we check the public record: building permits, city council and planning agendas, county recorder filings, state housing bills, police incident data and school results. Then we tie each story to what it means for specific neighborhoods, using Houseberry's own neighborhood data on prices, appreciation, safety, schools and amenities. Questions or corrections: Contact us.
Map of San Francisco Neighborhoods
Loading map...
View Full Map
Top Neighborhoods in San Francisco, CA





All information provided on this website including but not limited to - school ratings, safety, amenities, user opinions, and property data - is for general informational purposes only. We do not guarantee its reliability, accuracy, or completeness. Users should independently verify information and consult appropriate professionals as needed. By using this website, you agree Houseberry is not responsible for actions, decisions, or consequences arising from reliance on the information provided
houseberry.com - CA DRE# 01847391
 Bay East ©2025. CCAR ©2025. bridgeMLS ©2025. Information Deemed Reliable But Not Guaranteed. This information is being provided by the Bay East MLS, or CCAR MLS, or bridgeMLS. The listings presented here may or may not be listed by the Broker/Agent operating this website. This information is intended for the personal use of consumers and may not be used for any purpose other than to identify prospective properties consumers may be interested in purchasing. Data last updated at October 29, 2026 12:00 AM