Is Berkeley safe? It splits between the hills and the flats
Berkeley scores safer than Oakland and a bit below San Francisco, and its 18 neighborhoods range from 5.0 in the hills to 2.1 in the flats. Here is where each one lands and what it costs.

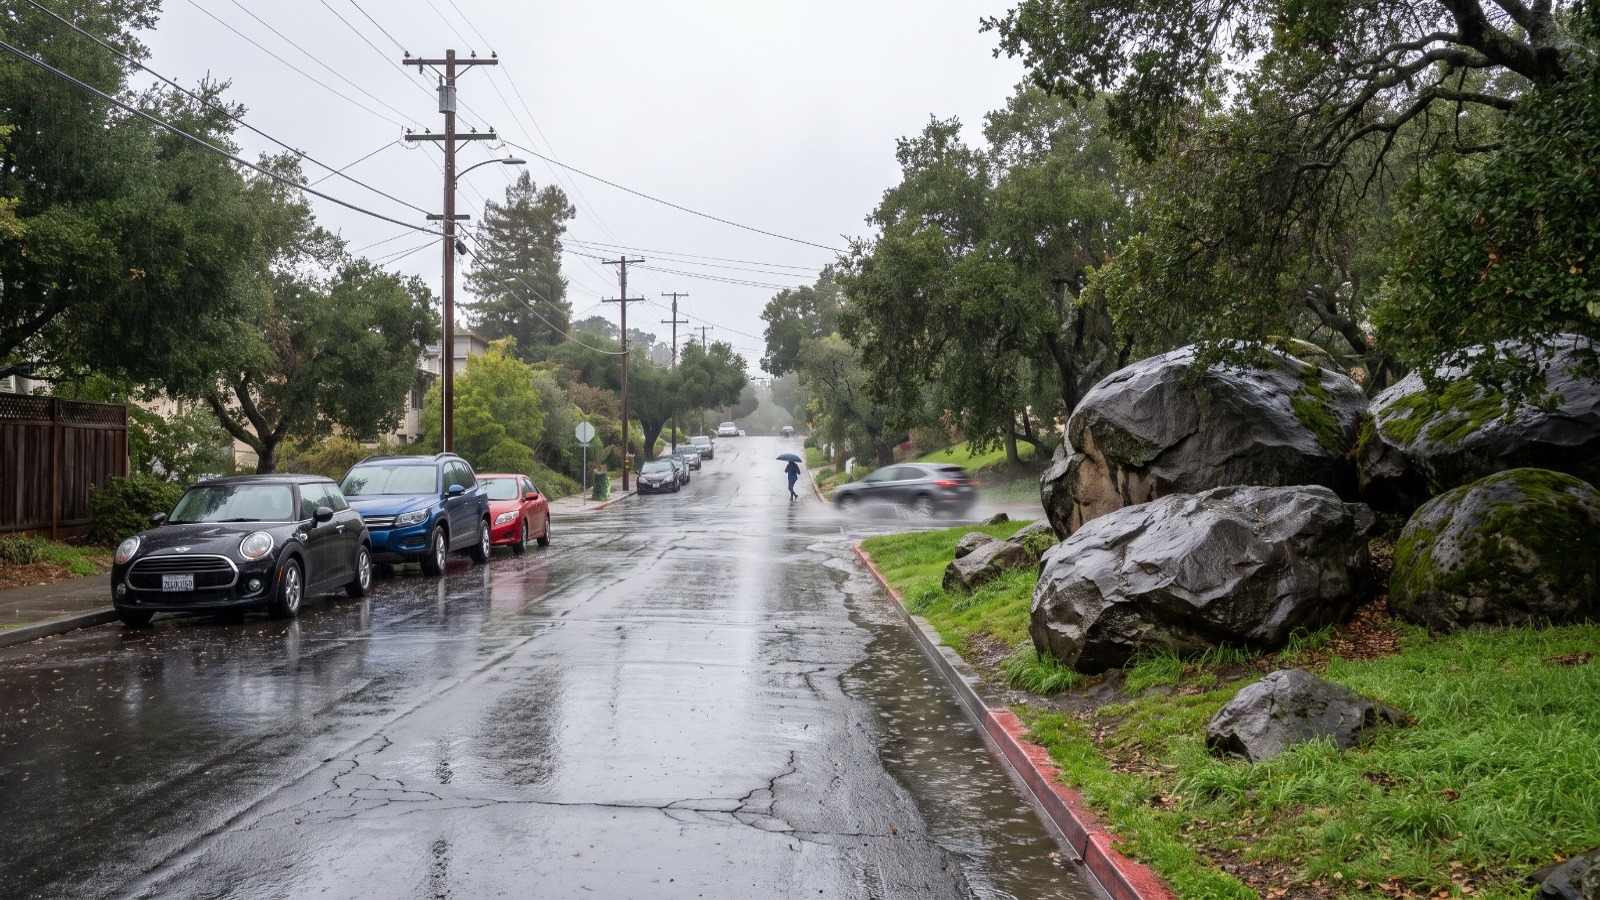
AI-rendered view of Indian Rock Avenue in Berkeley's Thousand Oaks neighborhood after rain, wet street and boulder park Photo: Houseberry
Berkeley is safer than Oakland and a notch below San Francisco, and the answer changes a lot by neighborhood. Houseberry scores the city 3.4 out of 5 on safety, against 3.0 for Oakland and 3.8 for San Francisco. Inside Berkeley the range runs from 5.0 in Claremont Hills to 2.1 in West Berkeley and South Berkeley.
So the honest answer to "is Berkeley safe" is a map, not a yes. The hills above the campus score near the top of the scale, and the flatlands toward the bay score below the city average. And Claremont, the most expensive neighborhood in town, is not one of the safest.
Where Berkeley's safest neighborhoods are
Claremont Hills leads the city at a perfect 5.0. It climbs from Tunnel Road toward Grizzly Peak above Claremont Canyon, on narrow lanes with long driveways and almost no through traffic. Houseberry also ranks it first overall in Berkeley, at 4.5.
Right behind it are Thousand Oaks and Panoramic Hill, both at 4.9. Thousand Oaks is the north Berkeley pocket of boulder parks around Indian Rock and Great Stoneface, a few blocks up from the shops on Solano Avenue. Panoramic Hill is the small cluster of hillside houses on the winding roads directly behind Memorial Stadium.
Berkeley Hills scores 4.8, and Northbrae, the grid of wide streets around Live Oak Park and the Marin Circle fountain, scores 4.4. LeConte, the blocks south of campus toward Ashby, rounds out the seven at 4.1.
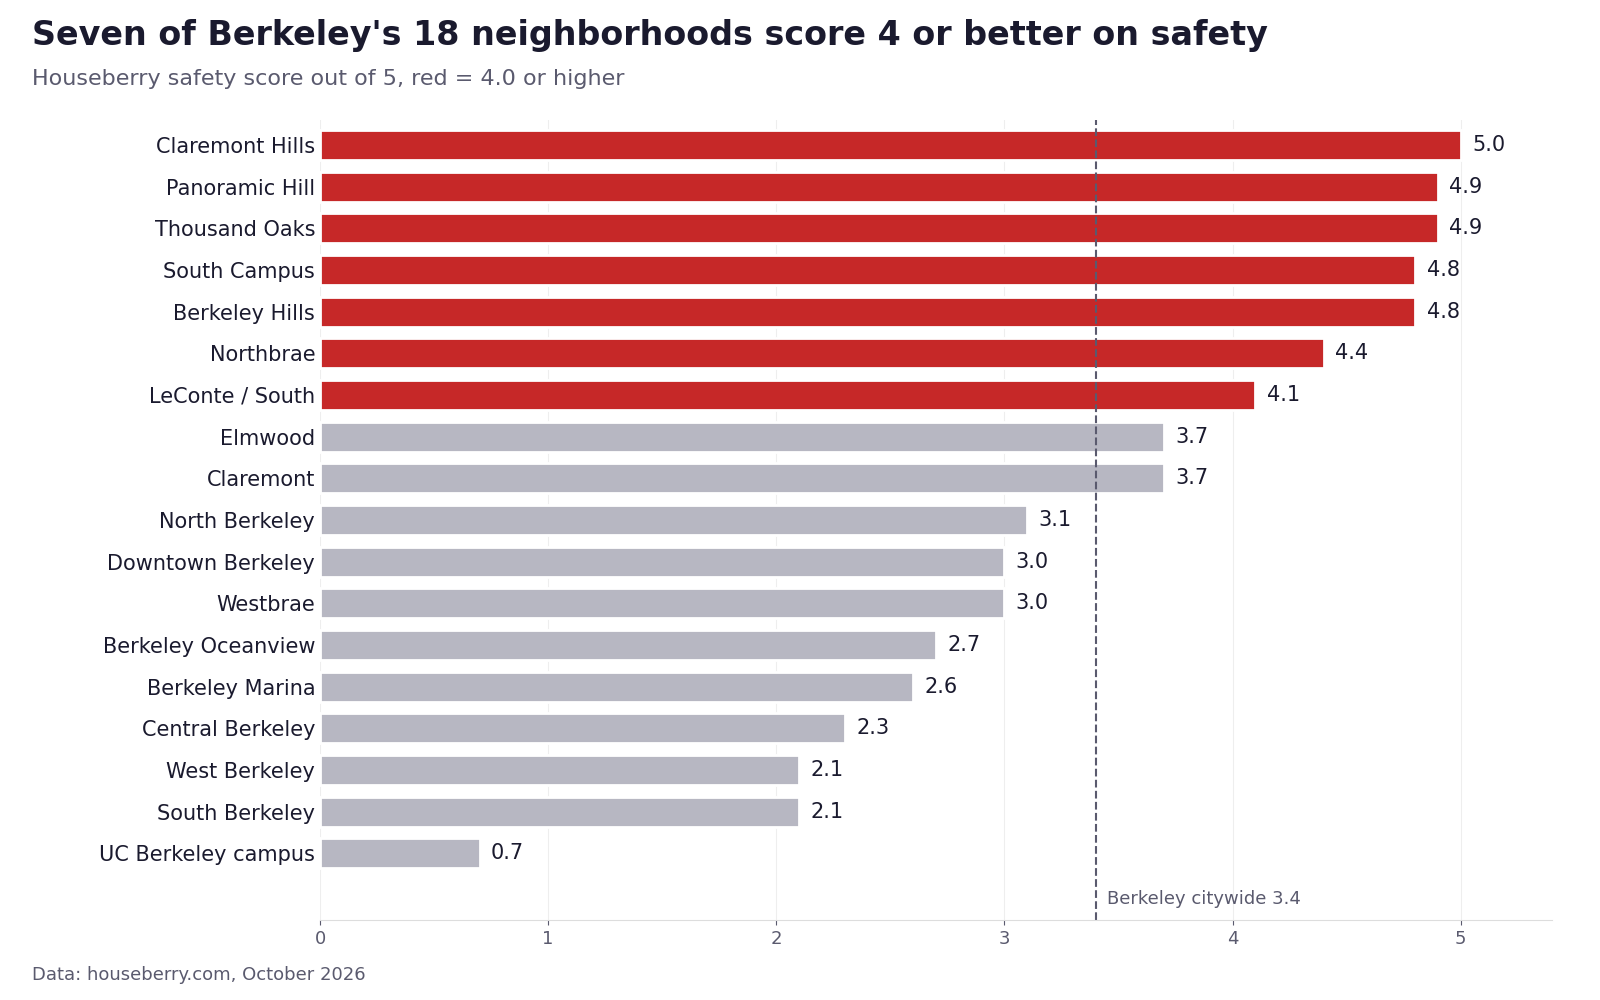
Then the scores fall off. Elmwood, the College Avenue district, and Claremont both land at 3.7. That is a little above the city.
North Berkeley scores 3.1. Westbrae and Downtown Berkeley score 3.0.
The bottom of the list is the flatlands between downtown and the shoreline. Berkeley Oceanview scores 2.7, the Berkeley Marina 2.6, Central Berkeley 2.3, and South Berkeley and West Berkeley 2.1 each.
The hills and the flats are 2.3 points apart
Put the two halves side by side and the split is hard to miss. The five hill neighborhoods (Claremont Hills, Thousand Oaks, Panoramic Hill, Berkeley Hills and Northbrae) average 4.8 on safety. The six neighborhoods across the flatlands (Westbrae, Oceanview, the Marina, Central, South and West Berkeley) average 2.5.
That 2.3-point gap is a Houseberry calculation, and it lines up with how the city is built. The hills are almost all houses on curving streets with little retail and few through routes. The flats carry San Pablo Avenue, University Avenue, the Adeline corridor, Fourth Street and the freeway, which means more cars, more storefronts and more of the reports a safety score counts.
The flats also score well on other things. Berkeley Oceanview scores 4.6 on amenities, the highest in the city. South Berkeley and Central Berkeley score 4.0 and 4.1 on schools. A lower safety score is one number among several, and we would not rule out a neighborhood on it alone.
Paying more does not buy a higher score
The priciest neighborhood in Berkeley is Claremont, the streets of large homes around the Claremont Hotel, at about $2.78 million in September 2026. Its safety score is 3.7.
Claremont Hills, directly uphill, scores 5.0 at about $1.61 million. That is roughly $1.18 million less for the top score in the city.
Panoramic Hill is the starkest case. It scores 4.9, ties for second, and its typical home was about $1.12 million in September 2026, the lowest price of any priced Berkeley neighborhood. LeConte scores 4.1 at about $1.29 million.
| Neighborhood | Safety | Overall | Typical home, Sept 2026 |
|---|---|---|---|
| Claremont Hills | 5.0 | 4.5 | $1.61M |
| Thousand Oaks | 4.9 | 4.3 | $1.90M |
| Panoramic Hill | 4.9 | 4.3 | $1.12M |
| Berkeley Hills | 4.8 | 4.3 | $1.82M |
| Northbrae | 4.4 | 4.1 | $2.47M |
| LeConte / South | 4.1 | 4.0 | $1.29M |
| Claremont | 3.7 | 3.9 | $2.78M |
| Elmwood | 3.7 | 3.9 | $1.71M |
The citywide typical home was about $1.62 million in September 2026, according to the Berkeley city page. Three of the seven high scorers come in at or under that figure.
Our read: in Berkeley, the premium buys the Claremont Hotel, the big lots and the College Avenue shops, and it does not buy a better safety number.
Berkeley next to Oakland and San Francisco
Is Berkeley safer than Oakland?
Yes, by every measure we checked. Houseberry's Alameda County city ranking scores Berkeley 3.4 and Oakland 3.0. Berkeley ranks 9th of 15 county cities, and Oakland ranks 14th.
The police counts point the same way. Berkeley recorded 1 homicide in 2025, according to preliminary Berkeley Police Department data reported by The Berkeley Scanner. Oakland recorded 67, according to city figures reported by KTVU. Oakland has about three and a half times Berkeley's population, so even per resident the gap is wide.
Our neighborhood answer for Oakland is in Is Oakland safe?
Is Berkeley safer than San Francisco?
Not on our scale. San Francisco scores 3.8 citywide on its city page, 0.4 above Berkeley. Albany, Berkeley's small neighbor to the north, also scores 3.8.
Part of that is the mix. San Francisco has 92 ranked neighborhoods and a long run of quiet residential districts on the west side. Berkeley has 18, and its campus and its commercial flats are a bigger share of the whole. Our San Francisco answer breaks that city down the same way.
Is Berkeley getting safer?
Mostly. Total crime reports fell about 12 percent in 2025 to roughly 8,800, according to the same preliminary BPD figures. Robberies dropped from 223 to 179. Vehicle thefts fell by half, from 1,048 to 528. Shootings fell from 30 to 15.
2026 is mixed so far. Through July, robberies were down 12 percent from the same stretch of 2025, while vehicle thefts were up 11 percent, according to The Berkeley Scanner's August update of BPD's Transparency Hub data. The city publishes its own dashboards and annual reports on the Berkeley Police crime data page.
Is Berkeley safe for students and at night?
The campus itself scores 0.7, the lowest in the city. Read that as a campus number. The UC Berkeley campus is a workplace and a school for tens of thousands of people a day and has few permanent residents, so it is a different kind of place from the neighborhoods around it.
The blocks where many students rent tell a different story. South Campus, between Bancroft and Dwight, scores 4.8. Houseberry's page flags South Campus for limited data, so we would weigh that number less than the hill scores. Downtown Berkeley, by the BART station, scores 3.0.
Our scores do not split by time of day. For late nights, the university runs a free Night Safety program: a Safewalk escort from dusk to 3 a.m., a night shuttle from 7:30 p.m. to 3 a.m. seven days a week, and door-to-door rides from 3 to 5:30 a.m., at 510-642-9255.
So, is Berkeley safe?
Berkeley as a whole sits in the middle of Alameda County, safer than Oakland and Emeryville and below Albany and San Francisco. The useful answer is the neighborhood. Seven of its 18 neighborhoods score 4 or better, they cluster in the hills, and three of them cost less than the city's typical home.
If safety is the deciding factor, start with Claremont Hills, Panoramic Hill and LeConte on the Berkeley safety ranking, then check how each one does on schools and shops on the overall ranking.
Sources
- Houseberry, Berkeley safety ranking and overall ranking, scores updated October 2026
- Houseberry, Berkeley city page and neighborhood pages, price history through September 2026
- Houseberry, Safest cities in Alameda County and San Francisco city page, October 2026
- The Berkeley Scanner, What happened in Berkeley crime and safety in 2025?, December 2025, preliminary BPD data
- The Berkeley Scanner, Berkeley crime update, August 2026
- KTVU, Oakland mayor, city leaders tout lower crime rates in 2025, January 2026
- City of Berkeley, Police crime data
- UC Berkeley, Night Safety services
The Houseberry Research Team is Houseberry's reporting team: Bay Area real estate analysts, data specialists and longtime local market watchers. Every day we check the public record: building permits, city council and planning agendas, county recorder filings, state housing bills, police incident data and school results. Then we tie each story to what it means for specific neighborhoods, using Houseberry's own neighborhood data on prices, appreciation, safety, schools and amenities. Questions or corrections: Contact us.
Map of Berkeley Neighborhoods
Loading map...
View Full Map
Top Neighborhoods in Berkeley, CA


All information provided on this website including but not limited to - school ratings, safety, amenities, user opinions, and property data - is for general informational purposes only. We do not guarantee its reliability, accuracy, or completeness. Users should independently verify information and consult appropriate professionals as needed. By using this website, you agree Houseberry is not responsible for actions, decisions, or consequences arising from reliance on the information provided
houseberry.com - CA DRE# 01847391
 Bay East ©2025. CCAR ©2025. bridgeMLS ©2025. Information Deemed Reliable But Not Guaranteed. This information is being provided by the Bay East MLS, or CCAR MLS, or bridgeMLS. The listings presented here may or may not be listed by the Broker/Agent operating this website. This information is intended for the personal use of consumers and may not be used for any purpose other than to identify prospective properties consumers may be interested in purchasing. Data last updated at October 27, 2026 12:00 AM