Davis's draft map could add 21,000 homes. Here's where
Davis's revised draft General Plan map has room for about 21,000 homes in four growth areas, most of it farmland that would still need a citywide vote. Here is which land, and how the neighborhoods next door score.

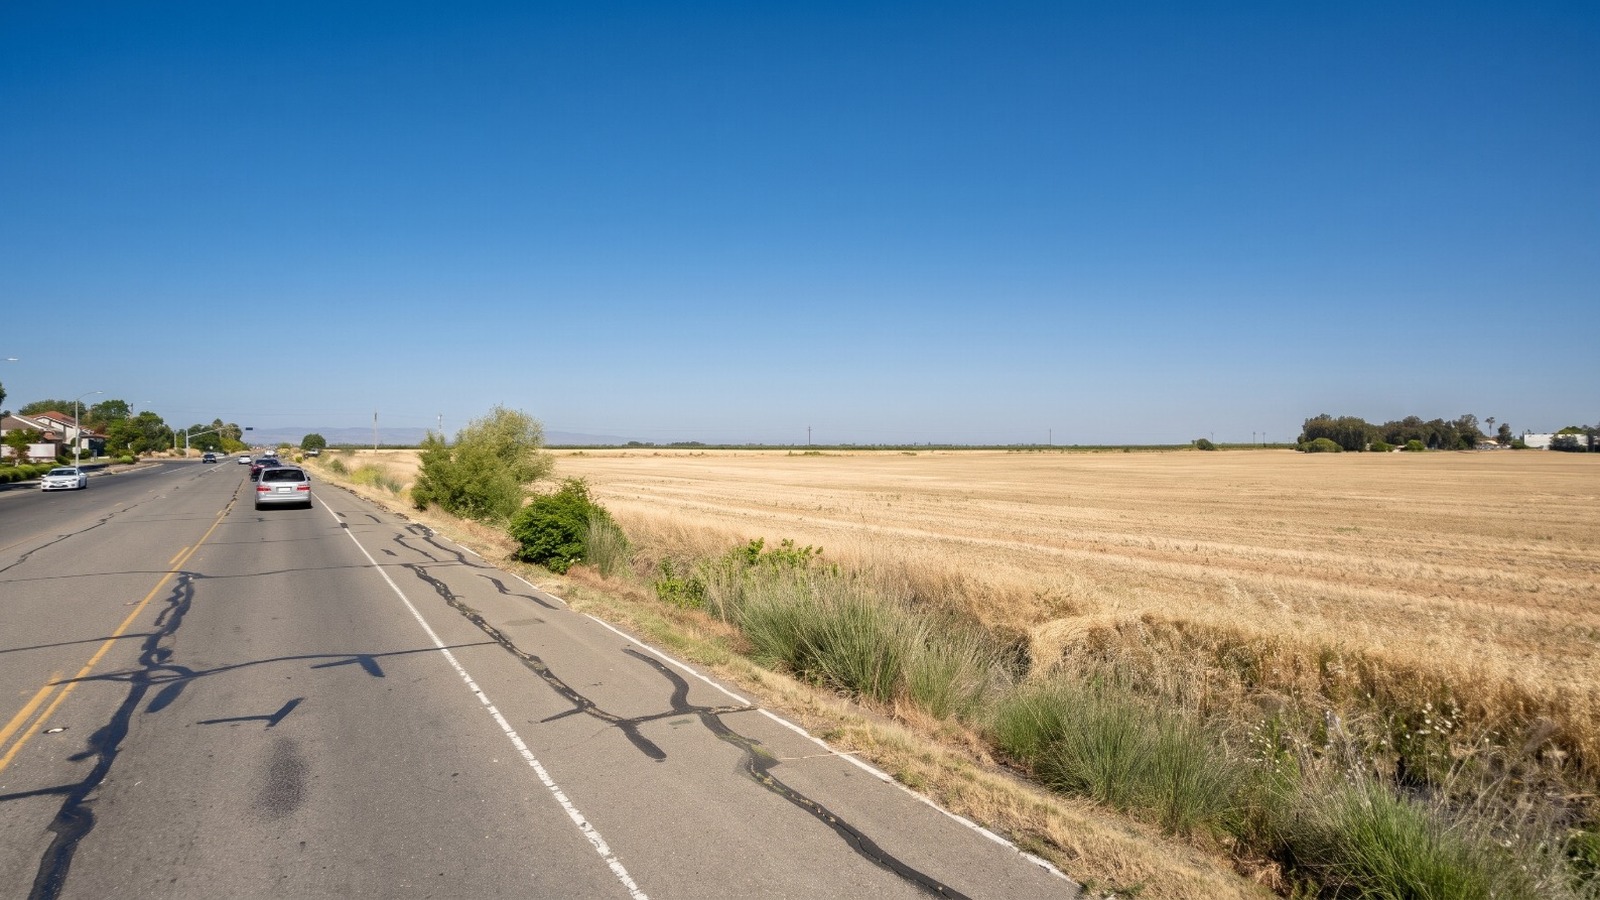
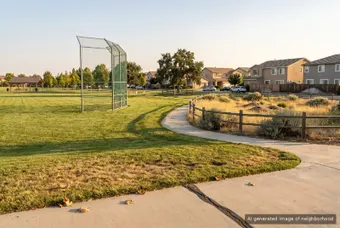
AI-rendered view of West Covell Boulevard on the northwest edge of Davis at midday, with the farm field in the draft West growth area on the right Photo: Houseberry
Drive West Covell Boulevard past Lake Boulevard and the city stops on your left. On your right is a plowed field that runs flat to the Coast Range. On the City of Davis's new draft land use map, that field and the land around Highway 113 north of it are colored in for apartments, shops and offices.
That is one of four growth areas on the revised draft map Davis showed at its third General Plan workshop on October 14. Add up the deck's own estimates and the map has room for about 21,000 new homes by 2050, most of them on farmland outside today's city limits. For a city that Houseberry ranks first of eight Yolo County cities at 4.2 out of 5 overall, this is the first official picture of where the next Davis would go. Residents can comment on it through November 13.
Where the four growth areas sit
The Workshop 3 deck draws the city as a box cut into four pieces. Three of them are outside the line.
West is the largest. It takes in the farm ground north of West Covell, from the edge of West Davis east across Highway 113 and north to County Road 29. The draft colors it with medium and high density housing, general commercial along 113 and a business park block, with drainage channels kept as open space. A smaller piece sits west of Lake Boulevard, between Covell and Russell. The deck's label for the whole thing is blunt: "Add housing west of city."
Northeast runs north of East Covell Boulevard. It includes the ground between F Street and Pole Line Road where Village Farms was proposed, the fields east of Wildhorse where Willowgrove is now on the ballot, and new business land at the Mace curve beside Interstate 80.
South is the land below El Macero, on both sides of Mace Boulevard, reaching toward Putah Creek and the Solano County line. Commissioners asked the city to consider annexing land in Solano County, and the draft shows housing blocks there with almost no jobs.
City limits covers the 3,000 homes inside town: a larger, taller downtown, housing above shops at neighborhood centers, mixed use along transit corridors such as Fifth Street, and more homes on some school district and church sites.
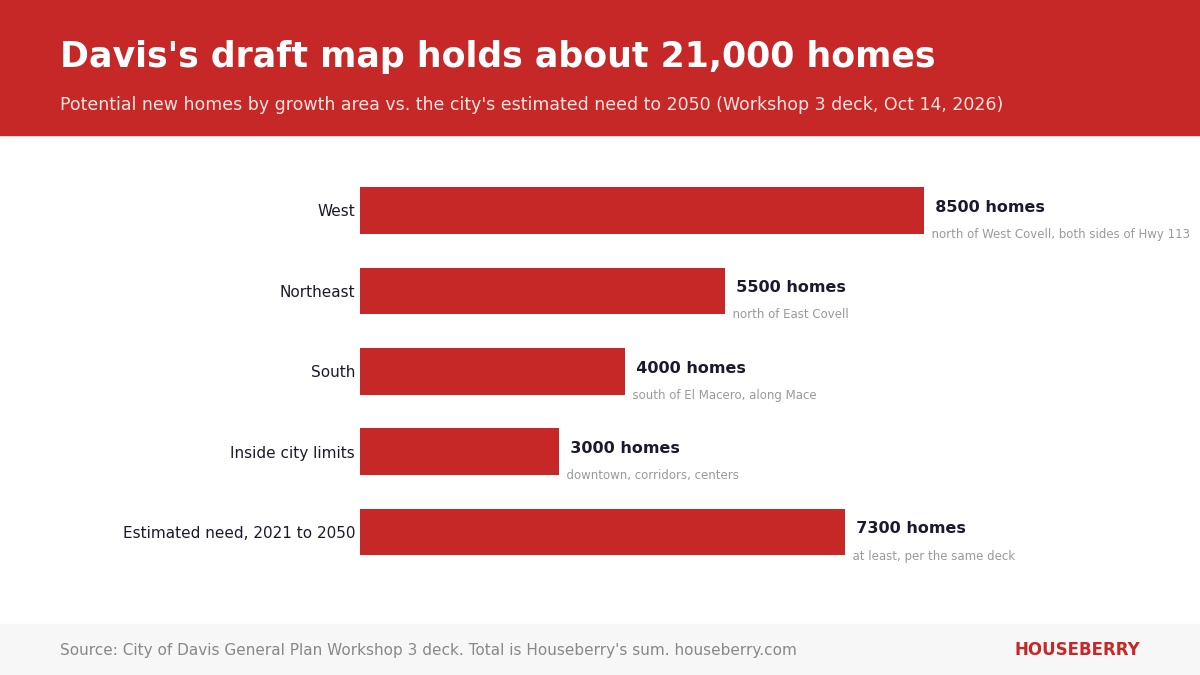
Our 21,000 is a sum the city did not print
Slide 46 is titled "Estimated Projections," and the residents box says "potential new." The deck never totals the homes. We did. Read it as the capacity of the land the map designates if every block were built out, which is how general plan maps work. It is not a construction schedule.
The deck also says the map could bring about 65,000 potential new residents and 2,500 students. The U.S. Census Bureau estimated Davis's population at 66,110 in July 2025. So the map, fully built, roughly doubles the city. The 2001 General Plan aimed to hold Davis under 64,000 residents, the Davis Vanguard reported in July. That cap is gone in this draft.
Scale it against the recent pace. Davis has added about 2,300 homes since 2010, the Davis Enterprise reported. The draft map holds roughly nine times that.
Every acre outside town still needs a citywide vote
This is the part a homeowner on the edge should understand first. The October 14 map designates land. It does not annex a single acre, rezone it or approve a subdivision.
Davis voters passed Measure J in 2000, renewed it as Measure R in 2010 and again as Measure D in 2020, 25,761 votes to 5,370. It requires a citywide vote before farmland or open space at the edge becomes urban development. Measure D runs to December 31, 2030. Yolo County's local agency formation commission also has to expand Davis's sphere of influence before the city can annex anything.
So the West, Northeast and South areas would each come back to voters, project by project, under the law as it stands. Voters have not been kind to those projects. In June, they rejected the 1,800-home Village Farms plan by 276 votes. The 1,250-home Willowgrove plan, inside the draft's Northeast area, is Measure W on the November 3 ballot, as we covered in our look at the region's local measures.
What the neighborhoods next door look like on our scores
Houseberry scores 57 Davis neighborhoods, and all 57 land between 3.9 and 4.5 out of 5 overall on our Davis neighborhood rankings. The growth areas would sit beside different parts of that range, as Houseberry's averages by part of town show.
| Part of Davis | Next to | Neighborhoods we score | Average overall | Average school score |
|---|---|---|---|---|
| West Davis, west of Highway 113 | West | 9 | 4.3 | 4.6 |
| North Davis, north of Covell | West and Northeast | 7 | 4.2 | 4.5 |
| Northeast, east of Pole Line | Northeast | 3 | 4.2 | 4.4 |
| South Davis and El Macero | South | 13 | 4.0 | 4.2 |
| Woodland, for comparison | 9 | 3.2 | 2.7 |
West Davis is the most uniform part of town in Houseberry's data. All nine neighborhoods we score there, including Village Homes and Stonegate, sit at 4.3 overall. South Davis is the lowest band. Nine of the 14 Davis neighborhoods that score below 4.0 are south of Interstate 80, among them Oakshade, and the South area would add 4,000 homes beside them with fewer than 500 jobs.
In the Northeast, the new blocks would sit across Covell from Mace Ranch, tied for the top overall score in the city at 4.5, and beside Wildhorse, at 3.9.
The comparison that matters most to a buyer is down Highway 113. The lowest-scored Davis neighborhood, at 3.9, still outscores the best of the nine neighborhoods on our Woodland rankings, which top out at 3.4. School scores explain most of it: 4.1 to 4.6 in Davis, 2.4 to 3.0 in Woodland. Davis is the part of Yolo County our scores rate highest, and it is the part with the least room to build.
The case against, and why we think the map is right
The objections are real. Every outside area is farmland, and the Enterprise reported that the Highway 113 and County Road 29 area sits in a floodplain the city calls a major constraint. Water, sewer and treatment capacity are still under study. UC Davis now houses 42 percent of its students on campus, up from 29 percent in 2016-17, according to the deck, which takes some pressure off town. And school enrollment in Davis Joint Unified has fallen 5.5 percent since 2019-20.
We think the map is the right call anyway. Davis has spent 25 years treating every edge project as a referendum, and it has added homes at roughly 160 a year. This draft puts a number on the edge for the first time. A city that designates three times its minimum need is a city that expects some of these votes to fail, which is the honest way to plan under Measure J.
The slide also shows the job math. About 18,009 employed residents, 56 percent, leave Davis for work, and 10,358 workers commute in. The West and Northeast areas carry 14,000 of the map's roughly 16,000 new jobs. That is the plan's real argument. Put the jobs where the homes go, and fewer people drive Interstate 80 every morning.
How to weigh in before November 13
Questionnaire 3 is open on the Davis General Plan site through November 13. The city repeats the workshop as a webinar on Thursday, October 29, from 6 to 7 p.m. The Transportation Commission takes up the draft maps on November 9 and the General Plan Committee on December 9, with Planning Commission and City Council hearings in early 2027.
If you own along West Covell, East Covell or Mace Boulevard, the map shows what could go up across the road from you. Before you answer Questionnaire 3, see how your neighborhood scores today on our Davis neighborhood rankings. The field behind the fence is the one thing in Davis this plan is built to change.
Sources
- City of Davis, General Plan Workshop 3 deck, October 14, 2026
- Davis 2050 General Plan Update site
- Yolo County Elections, Measure D results, November 3, 2020
- U.S. Census Bureau QuickFacts, Davis city
- Davis Vanguard, July 2026 General Plan staff recommendation
- Davis Enterprise, joint commission meeting on the General Plan update
The Houseberry Research Team is Houseberry's reporting team: Bay Area real estate analysts, data specialists and longtime local market watchers. Every day we check the public record: building permits, city council and planning agendas, county recorder filings, state housing bills, police incident data and school results. Then we tie each story to what it means for specific neighborhoods, using Houseberry's own neighborhood data on prices, appreciation, safety, schools and amenities. Questions or corrections: Contact us.
Map of Davis Neighborhoods
Loading map...
View Full Map
Top Neighborhoods in Davis, CA


All information provided on this website including but not limited to - school ratings, safety, amenities, user opinions, and property data - is for general informational purposes only. We do not guarantee its reliability, accuracy, or completeness. Users should independently verify information and consult appropriate professionals as needed. By using this website, you agree Houseberry is not responsible for actions, decisions, or consequences arising from reliance on the information provided
houseberry.com - CA DRE# 01847391
 Bay East ©2025. CCAR ©2025. bridgeMLS ©2025. Information Deemed Reliable But Not Guaranteed. This information is being provided by the Bay East MLS, or CCAR MLS, or bridgeMLS. The listings presented here may or may not be listed by the Broker/Agent operating this website. This information is intended for the personal use of consumers and may not be used for any purpose other than to identify prospective properties consumers may be interested in purchasing. Data last updated at October 23, 2026 12:00 AM