San Francisco Homes Sell for Double Asking. Still Under Median.
Two San Francisco homes sold for twice their list price this month and both closed below their own neighborhood's median. Here is what a west-side list price is actually telling you.
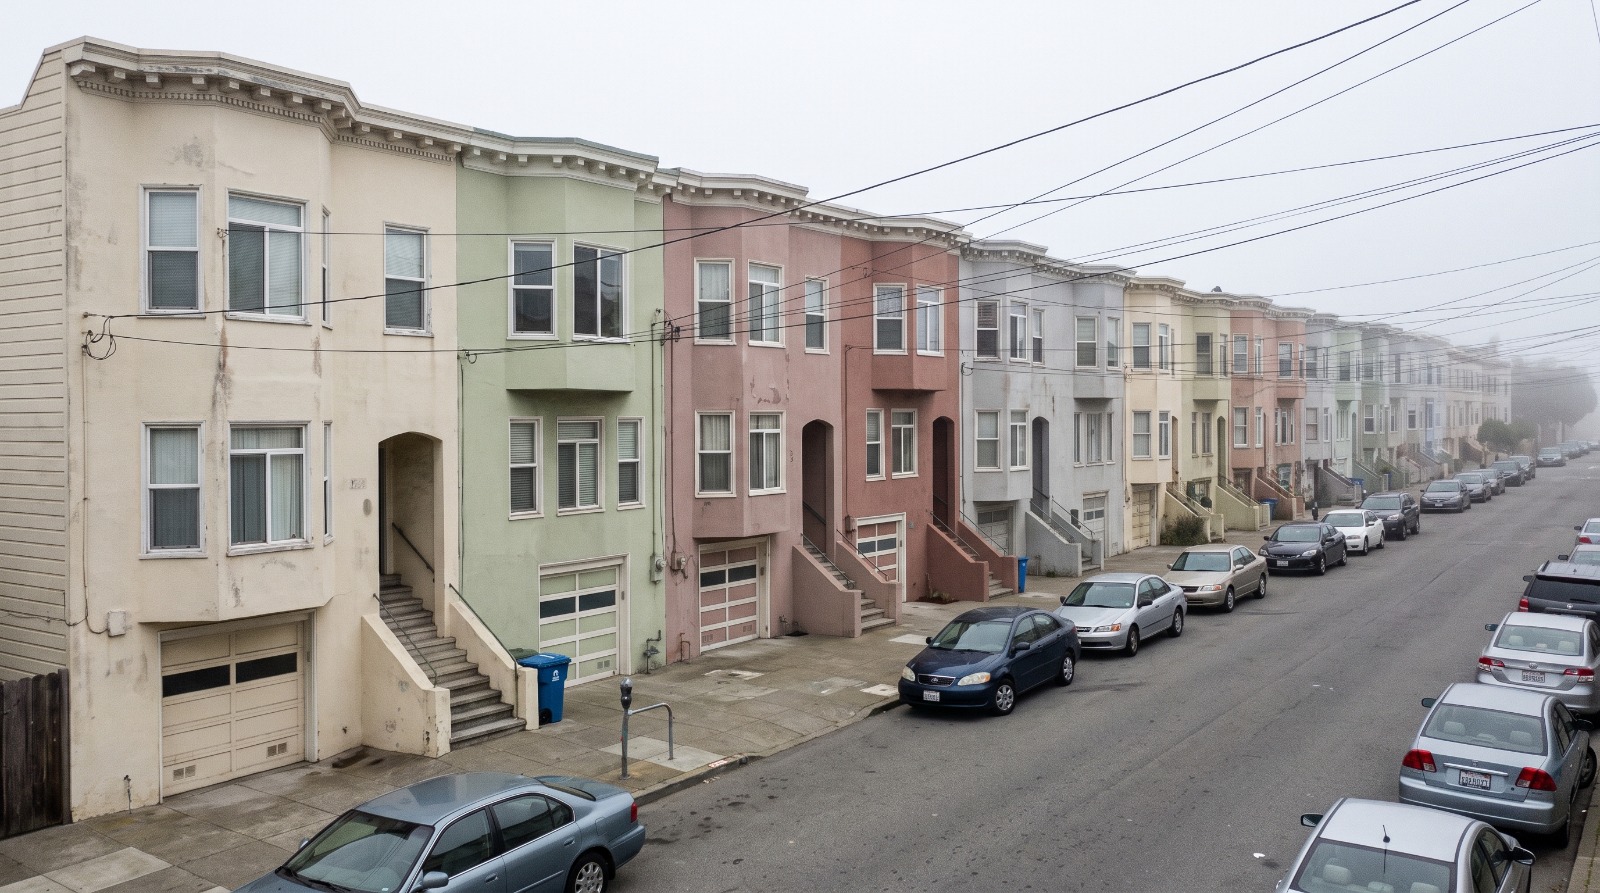
Two-story stucco row houses on a foggy Inner Parkside street in San Francisco, where a home recently sold for double its asking price. Photo: Houseberry
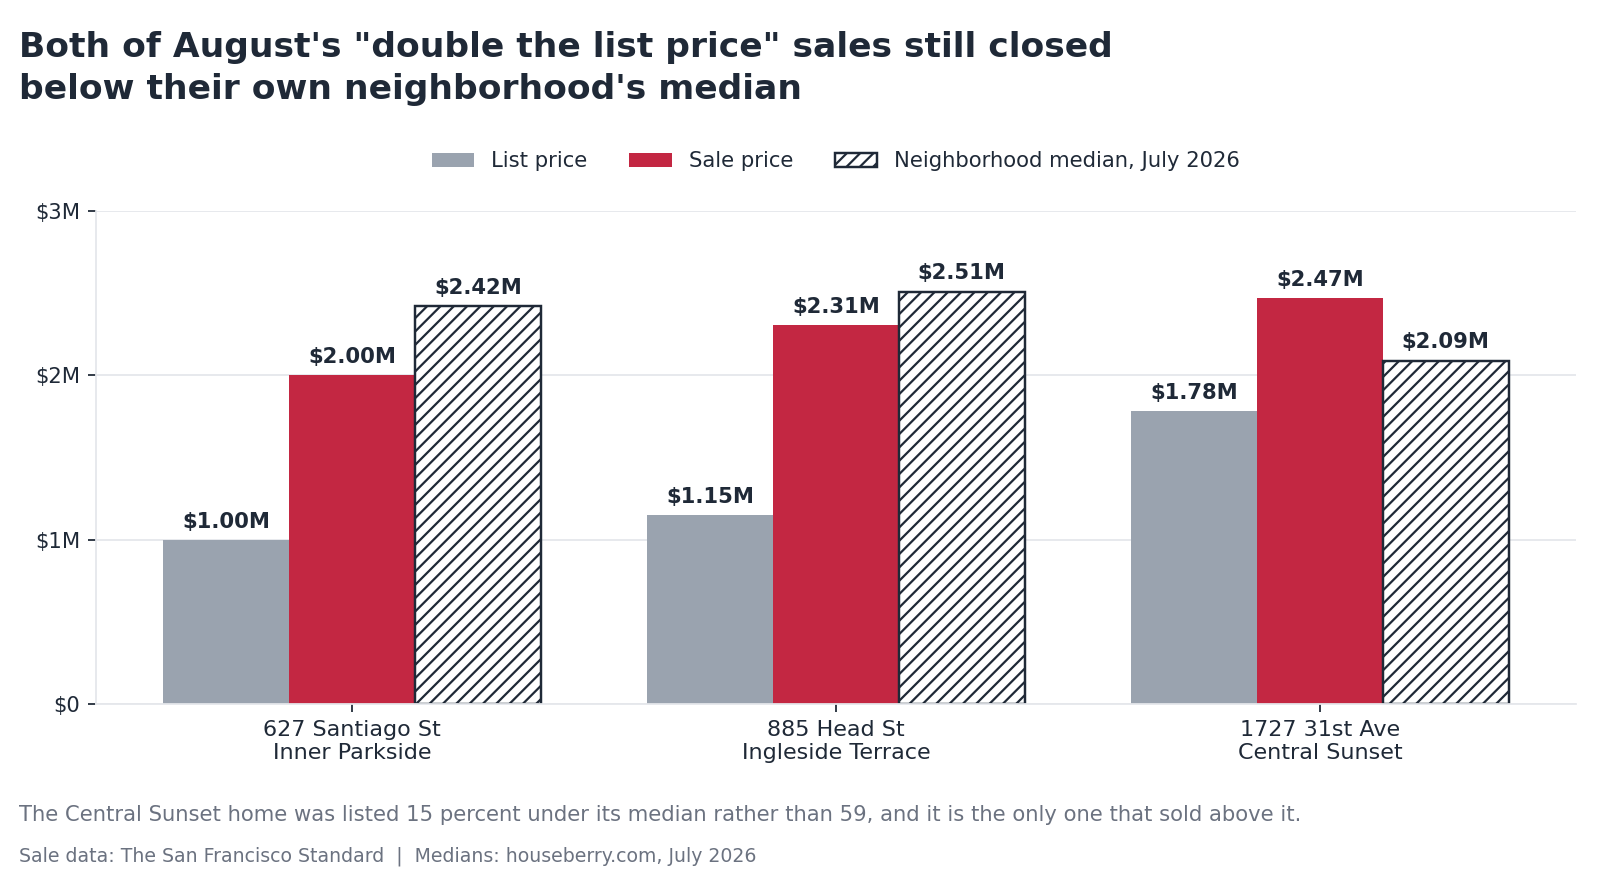
A house on Santiago Street in Inner Parkside listed at $1 million and sold for $2 million. All cash, eight days, fifteen offers. That is a real sale and it is a genuinely strange one. It is also, according to our own price data, a sale that closed about 17 percent below what the typical home in that neighborhood was going for in July.
So before anyone reads the doubling as proof that San Francisco has lost its mind: the multiple is measuring the discount, not the demand. When an agent lists a home 50 or 60 percent under what the block is worth, doubling the list price is what it takes just to get back to normal.
The list price was 59 percent below the block's own median
The Santiago Street house was not priced near market and then bid up. It was priced nowhere near market and then bid back toward it. The San Francisco Standard reported that the 1939 three-bedroom had been in one family for 55 years, got $45,000 of repairs, and went out at $1 million into a district with eight active single-family listings.
Set that $1 million next to the neighborhood. Inner Parkside carried a median of about $2.42 million in July 2026. The list price was 59 percent below the median. Getting to $2 million took fifteen offers and a cash buyer, and it still landed under the middle of the market.
That is the part the headline eats. Doubling sounds like a market on fire. Against the block's own numbers it reads as an auction that worked, roughly, and stopped a little early.
Ingleside Terrace set a record and still came in under the neighborhood
885 Head Street is the cleaner test, because it produced a genuine record. The 1920 two-bedroom listed at $1.15 million, drew 21 offers, and closed at $2,305,000. On a per-foot basis that is roughly $2,200, against a previous Ingleside Terrace high near $1,300.
A neighborhood record is a real event. But Ingleside Terrace had a median of about $2.51 million in July 2026, so even the record sale finished about 8 percent under the typical home there. Both things are true at once. The price per square foot was extraordinary because the house is small. The total price was not, because the house is small.
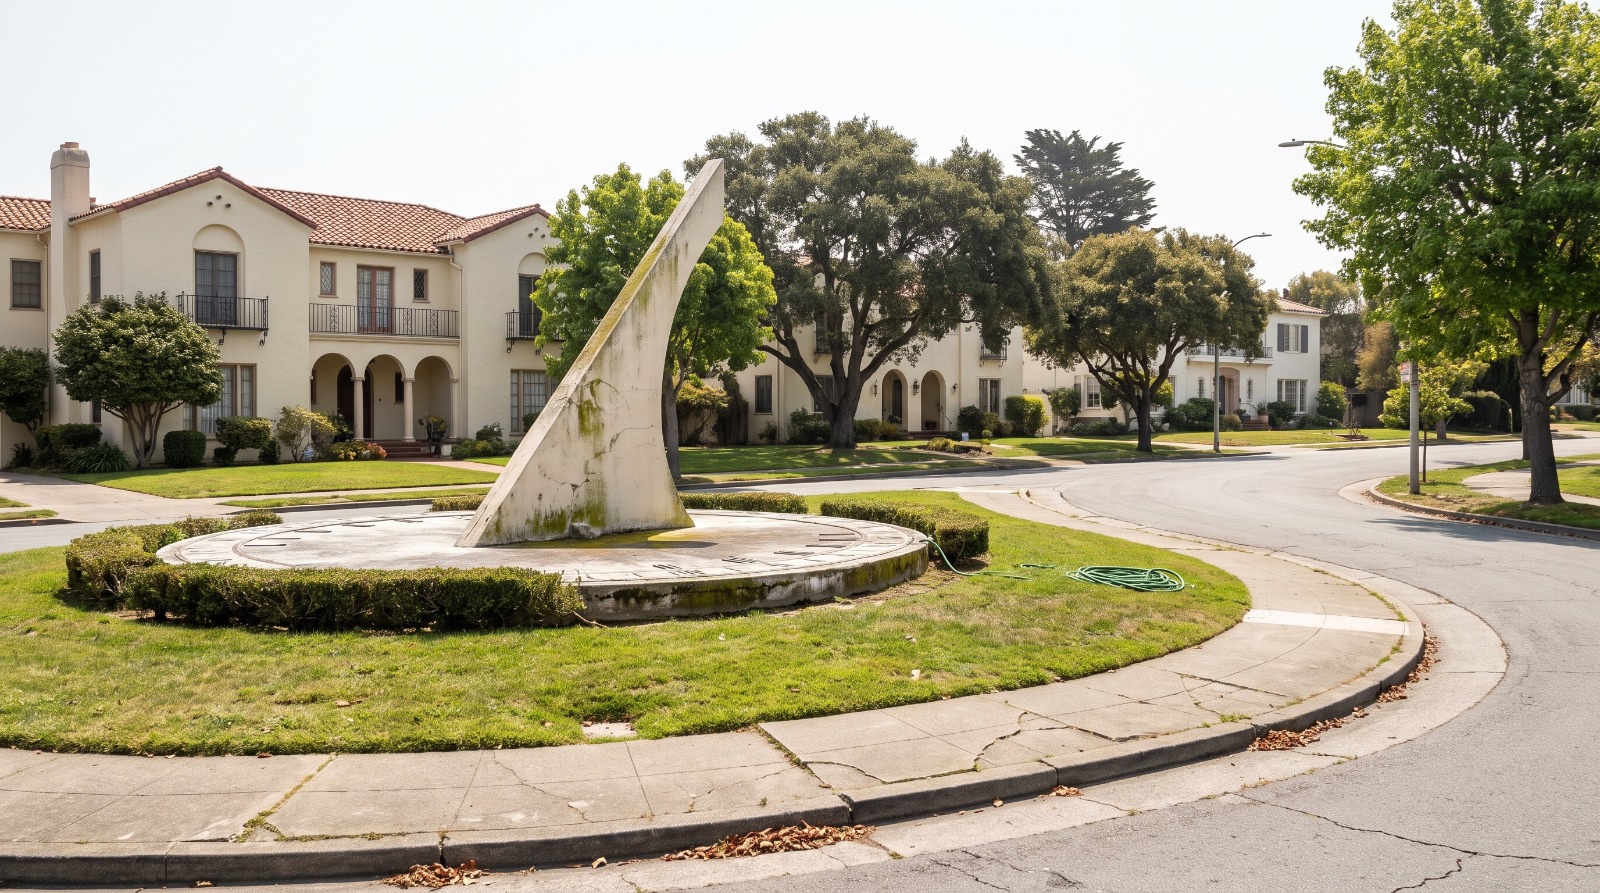
This is the neighborhood built inside the oval of a 1910s horse racetrack, with the big concrete sundial in the median of Urbano Drive. Large lots, Spanish Revival stucco, an unusual street grid. It is not a place where $1.15 million buys anything.
Why agents are listing a fifth under, and why it keeps working
Agents quoted in the Standard describe listing 20 to 25 percent below market value as ordinary practice now, on the theory that a realistic price actually scares buyers off because overbidding is so baked into how people read a listing. Treat that as practitioner testimony rather than a measured distribution. Nobody has published what share of San Francisco listings are underpriced by that much.
The mechanism behind it is not mysterious. Inventory collapsed. The Standard counted 156 active single-family listings citywide in July 2026, down about 40 percent year over year, with District 4 down to eight. That is where August's doubles happened, and it is where the cheapest list prices in the city are. Owners sitting on 3 percent mortgages and decades-old Prop 13 assessments have very little reason to sell, so the homes that do come up get auctioned.
We wrote about the other end of this in July, when 144 San Francisco homes sold for $1 million or more over asking in the first half of 2026. That was a luxury-market story driven by tech liquidity. Legacy SF Homes went back through 142 of those sales and found a median list price of $2,995,000, with nearly half of them listed above $3 million. This is the same behavior running on the west side at a quarter of the price, and the arithmetic looks completely different when you flip it from dollars to multiples.
Which citywide number you quote decides what story you tell
There is no single San Francisco sale-to-list ratio, and the spread between the published ones is wide enough to change the conclusion. The gap is mostly composition. Condos barely clear asking. Single-family homes on the west side clear it by a mile.
| Measure | Value | Period | Source |
|---|---|---|---|
| Median sale-to-list, all home types | 113.3% | June 2026 | Zillow |
| Share of sales above list, all types | 75.8% | June 2026 | Zillow |
| Average percent of list, single-family | 125.2% | Q2 2026 | Vanguard Properties |
| Share above asking, single-family | 84.8% | Q2 2026 | Vanguard Properties |
| Average percent of list, condo | 107.8% | Q2 2026 | Vanguard Properties |
| List-to-sale, District 2 single-family | 128.4% | 12 months to July 2026 | District Survey |
Read down that column and the honest summary is that a large premium over list is now normal in San Francisco, a doubling is not, and the widest spreads in the city sit in District 2, which is the Sunset and Parkside. August's doubles both landed in that district, which is what you would expect from the arithmetic rather than from any special heat.
What a west-side list price is worth
If you are shopping out here, the useful exercise is to stop comparing the sale price to the list price and start comparing the list price to the neighborhood. San Francisco's citywide median was about $1.64 million in July 2026, up from $1.47 million in June. Every neighborhood in the chart below sits above it.
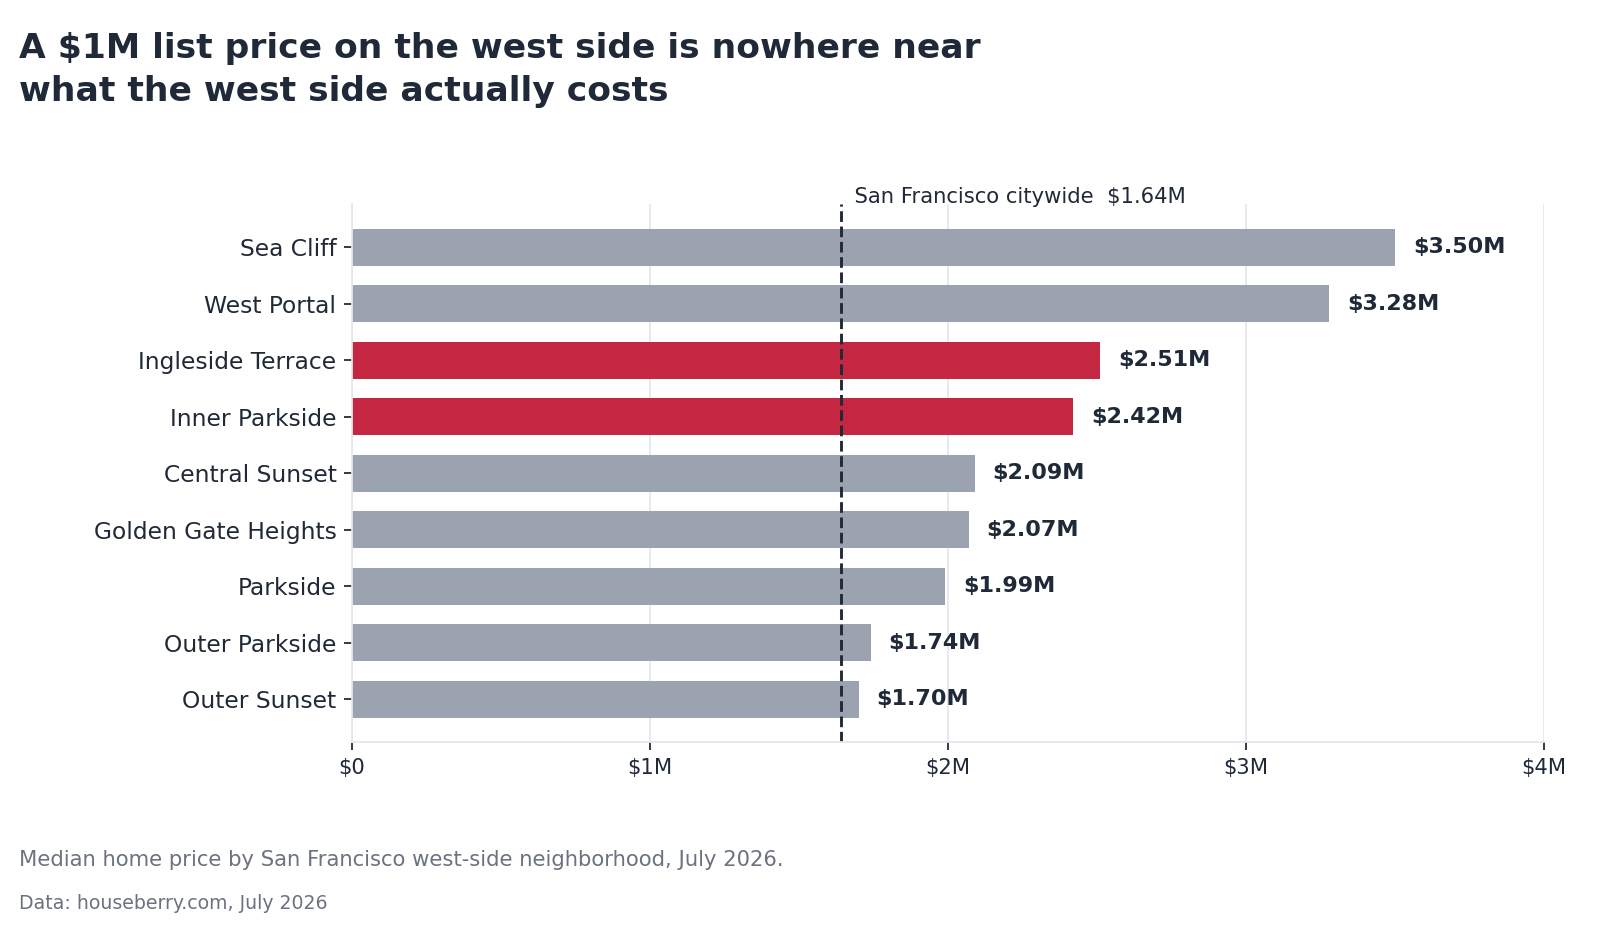
The cheapest neighborhood on that list, Outer Sunset, sat at about $1.70 million in July 2026. The most expensive, Sea Cliff, was more than twice that. A list price under $1.2 million anywhere in this set is a marketing decision, not a valuation.
The scores explain why these blocks draw fifteen offers
Price data tells you what happened. It does not tell you why 21 people wanted a two-bedroom on Head Street. That answer is in the livability numbers, and it is the reason we look at neighborhoods before addresses.
| Neighborhood | Overall | Schools | Safety | Median, July 2026 |
|---|---|---|---|---|
| Outer Sunset | 4.2 | 4.5 | 4.3 | $1.70M |
| Outer Parkside | 4.0 | 4.3 | 4.5 | $1.74M |
| Central Sunset | 4.0 | 4.2 | 4.5 | $2.09M |
| Inner Parkside | 3.9 | 4.0 | 4.6 | $2.42M |
| Parkside | 3.9 | 3.9 | 4.6 | $1.99M |
| Ingleside Terrace | 3.6 | 3.5 | 4.3 | $2.51M |
| San Francisco citywide | 3.4 | 3.3 | 3.9 | $1.64M |
Inner Parkside and Parkside both score 4.6 out of 5 on safety, against a citywide 3.9. Outer Sunset carries a 4.5 school score at the lowest median in the group. Those are the numbers that put fifteen people in a room on a Sunday, and they do not move much from month to month, which makes them a lot more useful for planning than a list price that changes meaning by district.
What this does and does not mean if you are buying
It does not mean the west side doubled in value. Two sales are two sales, and both of them cleared under their neighborhood median.
It does mean your search filters are lying to you. If a fifth to a quarter of the price is being held back from the listing, then a $1.5 million maximum in your filter is really a $1.1 million shopping list, and you will spend inspection and appraisal money on homes you were never in range for. The practical move is to set your range against neighborhood medians and treat the list price as an entry fee.
The honest downside runs the other way too. Underpricing is only free for the seller if the auction actually clears. One thin open house and you are anchored to a $1 million list in public. And a buyer bidding 100 percent over faces an appraisal that will not follow them there, and the Santiago Street sale went all cash. If you need financing, you are competing at a structural disadvantage in exactly the listings that look cheapest.
Not all of San Francisco plays this game. Pacific Heights ran about 101.6 percent of list over the twelve months to July 2026, with barely half of homes clearing asking. Several condo districts sat at exactly 100 percent. Underpricing is a west-side, single-family, entry-level tactic. Reading it as a citywide law will cost you money in both directions.
Straight answers about San Francisco list prices
Are San Francisco homes really selling for double the asking price?
A small number are. Two documented sales in August 2026 closed at almost exactly twice their list price, in Inner Parkside and Ingleside Terrace. The citywide picture is much less dramatic: single-family homes averaged 125.2 percent of list in the second quarter of 2026, and all property types together ran about 113.3 percent in June.
Why do San Francisco agents list homes below market value?
To start a bidding war in a market with almost no inventory. San Francisco had roughly 156 active single-family listings in July 2026, down about 40 percent from a year earlier. Agents interviewed by The San Francisco Standard say pricing 20 to 25 percent under market is now standard, because buyers have come to expect overbidding and read a realistic price as a warning sign.
How do I tell what a San Francisco home is actually worth?
Compare the list price to the neighborhood median rather than to other list prices. In July 2026 the medians ran from about $1.70 million in Outer Sunset to $3.50 million in Sea Cliff, against $1.64 million citywide. A listing far under its own neighborhood's median is priced for an auction.
Which San Francisco neighborhoods have the widest gap between list and sale?
District 2, which covers the Sunset and Parkside, ran a 128.4 percent list-to-sale ratio over the twelve months to July 2026, with 89 percent of homes selling over list and a median over-list premium of $430,000. That is the widest spread in the city. District 7, covering Pacific Heights, was near 101.6 percent.
The next time a doubling makes the rounds, the question worth asking is not how far over asking it went. It is what the block was worth before anyone wrote the listing. That is the number we build our San Francisco neighborhood pages around, and on the west side right now it is the only one doing any real work.
Sources
- The San Francisco Standard, August 17, 2026: SF homes selling for twice the asking price
- The San Francisco Standard, July 7, 2026: 144 SF homes sold $1M over asking
- The San Francisco Standard, July 23, 2026: open house frenzy in the Sunset
- Vanguard Properties Q2 2026 San Francisco market update, via Mark D. McHale and Associates
- Zillow San Francisco home values, June and July 2026
- District Survey San Francisco housing market update, updated August 13, 2026
- Legacy SF Homes analysis of the $1M-over-asking sales, July 23, 2026
- Houseberry neighborhood and city price data, July 2026
All information provided on this website including but not limited to - school ratings, safety, amenities, user opinions, and property data - is for general informational purposes only. We do not guarantee its reliability, accuracy, or completeness. Users should independently verify information and consult appropriate professionals as needed. By using this website, you agree Houseberry is not responsible for actions, decisions, or consequences arising from reliance on the information provided
houseberry.com - CA DRE# 01847391
 Bay East ©2025. CCAR ©2025. bridgeMLS ©2025. Information Deemed Reliable But Not Guaranteed. This information is being provided by the Bay East MLS, or CCAR MLS, or bridgeMLS. The listings presented here may or may not be listed by the Broker/Agent operating this website. This information is intended for the personal use of consumers and may not be used for any purpose other than to identify prospective properties consumers may be interested in purchasing. Data last updated at October 1, 2026 12:00 AM