San Mateo Schools Are Shrinking. San Carlos Is Growing.
San Mateo County has lost about 3,556 public school students since 2021, but the decline is uneven and San Carlos is actually growing. Here is how to read a school score against a district's enrollment trend before you buy.
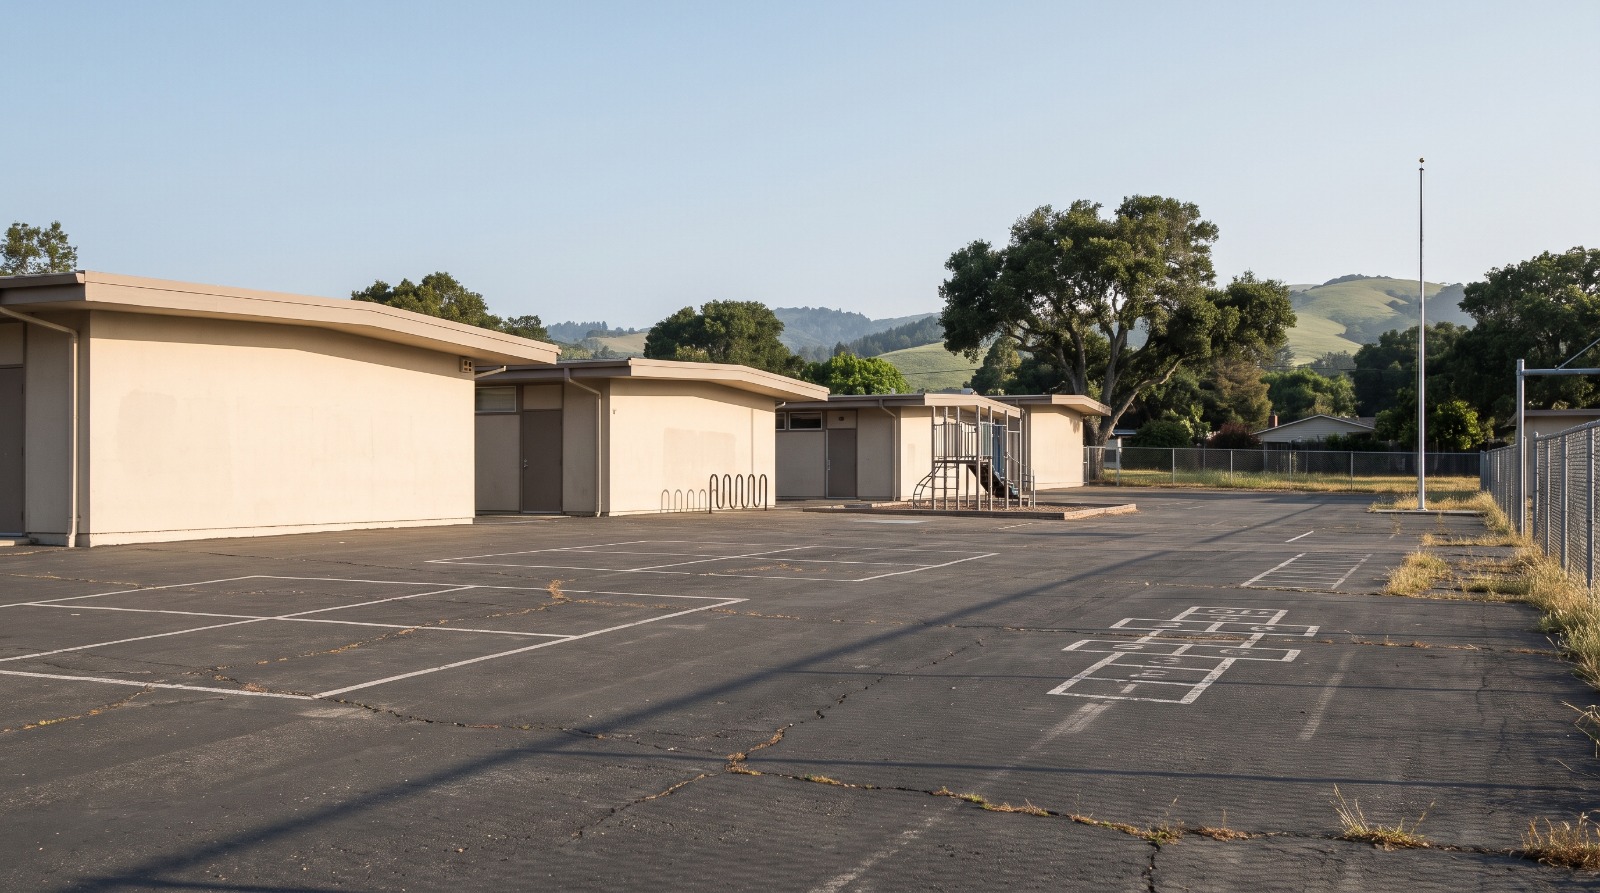
A quiet Peninsula elementary school campus in a San Carlos-style neighborhood, where San Mateo school enrollment trends vary widely by district. Photo: Houseberry
You found the house on the right block, the offer stuck, and the school score looked solid. Then a neighbor mentions the elementary school around the corner just merged two grades into one wing. That is the kind of detail that never shows up in a listing, and it is exactly what San Mateo school enrollment trends are quietly telling buyers right now.
Countywide, public schools have lost about 3,556 students since 2021, a drop of roughly 4 percent, according to a July review of state enrollment data. The slide is real, but it is not even. Sixteen of the county's 23 districts shrank. Seven grew. San Carlos grew the most. Where a district sits on that split says a lot about the neighborhoods around it.
The San Mateo school enrollment slide, by the numbers
The headline figure comes from California Department of Education data: roughly 3,556 fewer students across the county between the 2021-22 and 2025-26 school years. County charter programs accounted for about 813 of that loss on their own.
The biggest raw declines landed in two of the county's largest districts. Sequoia Union High shed about 711 students and posted its lowest enrollment in a decade. San Mateo-Foster City dropped about 649. San Mateo Union High and Redwood City Elementary also gave back sizable numbers. The steepest declines by percentage hit smaller districts on the coast and the bayshore, including Cabrillo Unified in Half Moon Bay, Pacifica, and Ravenswood.
This is not a one-year blip. Redwood City Elementary has lost about 17 percent of its enrollment over the past decade and is planning for a future closer to 6,400 students, down from nearly 10,000. Belmont-Redwood Shores is down about 9 percent over the same stretch. A district demographer put the cause plainly: the cohorts now in third grade and younger are simply smaller than the ones ahead of them.
San Carlos is the county's outlier
Then there is San Carlos. Its elementary district added about 339 students, an increase of roughly 11 percent, the largest gain in the county. In a county that is mostly shrinking, that makes San Carlos the exception worth understanding.
Growth changes the math for a district, in a good way. Most state funding is tied to attendance and enrollment, so a district that is adding students is defending or growing its budget while its neighbors face cuts. It feels less pressure to consolidate campuses, redraw attendance boundaries, or trim programs. That stability is easy to overlook when you are staring at a single school rating, and it is worth as much as the rating itself.
It also tracks with what the neighborhood data already shows. San Carlos carries some of the strongest school scores on the Peninsula, with neighborhoods like Cordes, Beverly Terrace, and East Belmont scoring between 4.6 and 4.9 out of 5 in how San Carlos neighborhoods rank by schools. A score like that tells you how the schools test today. The enrollment trend tells you how steady the ground under them is likely to be.
Why a shrinking district quietly changes a neighborhood
Falling enrollment does not mean a district has bad schools. Plenty of excellent schools are losing students for reasons that have nothing to do with quality, mostly fewer young kids being born and priced-out families leaving the county. But because the money follows the student, a shrinking headcount squeezes budgets even at strong schools, and that pressure shows up in ways buyers feel later: a closed campus, a redrawn boundary that moves your street to a different school, a cut music program, larger combined classes.
This is where looking at the area before the address earns its keep. Two homes a mile apart can feed districts moving in opposite directions. The way we look at it when we compare neighborhoods, a school score and an enrollment trend are two different signals, and you want both. The score answers how good the school is now. The trend hints at whether the boundary, the budget, and the programs are likely to hold.
What Peninsula buyers should actually check
If schools are part of why you are buying in a particular spot, a few minutes of homework goes a long way. Pull the district's enrollment trend, not only the test score for one school. Ask the district whether your target school's attendance boundary is under review, since consolidations often redraw them. Weigh a growing district like San Carlos against a shrinking one on stability, but do not treat one year of numbers as destiny.
It helps to start from the neighborhood and work down. You can see how the top-ranked San Carlos neighborhoods stack up on schools, safety, and price in one place, or check how Redwood City neighborhoods rank on schools if you are looking at a district that is managing a decline. Comparing the area first and the house second is the whole reason we built Houseberry, and enrollment trends are a clean example of why the neighborhood so often decides how a home actually lives.
The next real test comes with the fall enrollment counts and the budget decisions that follow them. Districts that keep sliding will be making hard calls about campuses and boundaries into 2027. Buyers who checked the trend, and not the score alone, will not be caught off guard by them.
Sources
All information provided on this website including but not limited to - school ratings, safety, amenities, user opinions, and property data - is for general informational purposes only. We do not guarantee its reliability, accuracy, or completeness. Users should independently verify information and consult appropriate professionals as needed. By using this website, you agree Houseberry is not responsible for actions, decisions, or consequences arising from reliance on the information provided
houseberry.com - CA DRE# 01847391
 Bay East ©2025. CCAR ©2025. bridgeMLS ©2025. Information Deemed Reliable But Not Guaranteed. This information is being provided by the Bay East MLS, or CCAR MLS, or bridgeMLS. The listings presented here may or may not be listed by the Broker/Agent operating this website. This information is intended for the personal use of consumers and may not be used for any purpose other than to identify prospective properties consumers may be interested in purchasing. Data last updated at September 12, 2026 12:00 AM