Is San Jose Safe? What 112 Neighborhood Scores Show
San Jose keeps topping safest-big-city lists, and its 112 Houseberry safety scores run from 4.8 to 1.3. Both facts are true. Here is how they fit together.
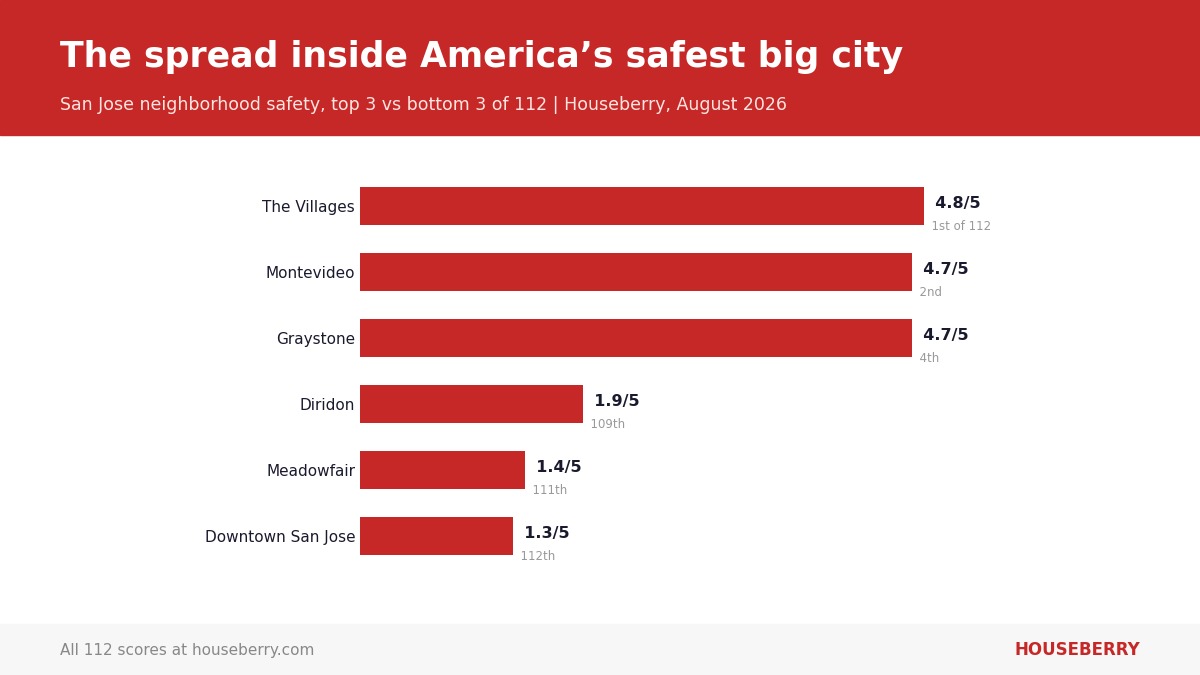
Chart answering is San Jose safe: neighborhood safety scores in 2026 range from 4.8 in The Villages to 1.3 in downtown San Jose across 112 scored neighborhoods. Photo: Houseberry
San Jose’s safest neighborhood is a 1,200 acre gated golf community in the eastern foothills where the streets are named after old vineyards. Its lowest scoring one is the downtown core two exits away. On Houseberry’s August 2026 data, San Jose’s 112 neighborhood safety scores run from 4.8 to 1.3, and that spread is the honest answer to the question. The city earns its safest-big-city reputation on average, and the average is doing a lot of quiet work.
All 112 scores live on Houseberry’s San Jose safety ranking. This piece is about the pattern they make.
Where does the safest-big-city claim come from?
It is not marketing. National comparisons have repeatedly put San Jose first among large U.S. cities on violent crime rates, a finding San José Spotlight covered when the most recent report landed, and the city’s own reported crime fell again in 2025. Houseberry’s numbers back the average up. San Jose’s neighborhoods average 3.7 out of 5 for safety, exactly matching the average across the five nearest cities, and 48 of the 112, about four in ten, score 4.0 or higher. For a city of nearly a million people, that is a genuinely deep bench of high scoring residential neighborhoods.
Which San Jose neighborhoods score highest?
The Villages tops the table at 4.8, the gated, age-restricted golf community built on old vineyard and ranch land off Yerba Buena Road. Right behind it come Montevideo at 4.7, a 1960s planned tract near Camden and Coleman that has quietly aged into its trees, and Graystone at 4.7 in the Almaden foothills. The belt continues through Cambrian and Calabazas North at 4.6.
Here is what makes San Jose different from the other big Bay Area cities. Its safest neighborhoods are not trading schools for quiet. Eleven of the seventeen neighborhoods scoring 4.5 or higher for safety also clear 4.0 on Houseberry’s school score, Calabazas North highest among them at 4.8. In Oakland, for comparison, only three of the eighteen top safety scorers clear even 3.5 for schools. The Almaden, Cambrian, and west side belts pair the two factors instead of splitting them, which is most of the reason their names come up in every relocation thread.
Look at where the high tier physically sits and a second pattern appears. The Villages, Silver Creek at 4.7, Graystone, and Santa Teresa Foothills East at 4.5 are all edge-of-city foothill geography, cul-de-sac networks with one or two roads in and out, some of them gated. Built form does a lot of quiet policing. A tract with no through traffic generates almost no opportunistic incident reports, and the score records that faithfully. It is a real effect, not a statistical trick, but it means the top of the table measures a specific suburban shape as much as it measures any city.
The exception worth knowing: East Foothills scores 4.6 for safety with a 2.6 school score, the one high scorer that does make the trade. To sort the full field on both factors at once, flip the ranking page between safety and schools.
How do the famous names score?
The neighborhoods people actually ask about land mid-table more often than their reputations suggest, in both directions. Willow Glen, the city’s postcard neighborhood, scores 4.0 for safety, 44th of 112, with its 4.2 amenities score along Lincoln Avenue doing exactly what busy retail strips always do to reported-incident counts. Almaden Valley reads 4.3 with a 4.2 for schools, and Evergreen matches it at 4.3 with a 4.7 school score, both a notch below the foothill tier but pairing the factors more evenly than almost anything above them. Rose Garden, for all its curb appeal, reads 3.9, and its 4.5 amenities score around The Alameda tells the same corridor story as Willow Glen.
| Neighborhood | Safety score | Safety rank of 112 | Overall score |
|---|---|---|---|
| Willow Glen | 4.0/5 | 44th | 3.7/5 |
| Almaden Valley | 4.3/5 | 20th | 4.1/5 |
| Evergreen | 4.3/5 | 21st | 4.2/5 |
| Rose Garden | 3.9/5 | 50th | 3.5/5 |
| Japantown | 3.4/5 | 79th | 2.7/5 |
| Santana Row | 3.0/5 | 94th | 3.0/5 |
The east side is the reputation gap running the other way. Mayfair scores 3.6, Little Saigon 3.3, and Alum Rock 3.2 as of August 2026, mid-band numbers for areas that two decades of shorthand still paint as the city’s trouble spots. The data puts most of the east side closer to Japantown at 3.4 than to anything at the bottom of the table.
Where do the low scores sit?
At the center. The five lowest scores as of August 2026 are Downtown San Jose at 1.3, Meadowfair at 1.4, Spartan Keyes at 1.5, and Diridon and Dobern at 1.9. Four of the five ring the downtown core, where the SoFA nightlife district, the SJSU corridor, and a thin residential population concentrate reported incidents against a small denominator. Meadowfair, on the east side, is the one outlier. And one genuine surprise for locals: Naglee Park, the leafy historic district beside campus, scores just 2.5, dragged by the downtown blocks it borders.
The sharpest downtown gap of any Bay Area big city
Cross-checking the three big cities on the same Houseberry scale makes San Jose’s shape unusual. Downtown San Jose’s 1.3 sits below both the comparable downtown scores in San Francisco, where Downtown proper reads 2.4, and Oakland, where Downtown reads 3.8. San Jose has the strongest edges and the lowest scoring core of the three. That is the whole safest-big-city paradox in one line: the label is set by hundreds of residential square miles, and the visitor experience is set by the one square mile that scores worst.
What the average cannot promise
Read the caveats before the conclusions. These scores count reported incidents normalized by residents, so entertainment districts with big daytime and nighttime crowds score worse than their streets may feel, and quiet areas underreport by nature. A 4.8 behind a gate with an age restriction is a very specific kind of quiet that says little about the rest of the city. And a safety score is one factor of six that Houseberry tracks, as East Foothills shows. The number is context for a decision, not a verdict on a place.
Where this is heading
Watch the core. The Diridon station area carries the city’s largest approved housing pipeline, and we tracked what has actually been built in our Diridon approved-versus-built piece. Downtown scores are low partly because few people live there yet. Every project that adds residents thickens the denominator and adds street life, which is how downtown numbers historically improve. If San Jose closes even half the gap between its core and its edges, its big-city average stops needing an asterisk.
So does the label hold up?
As a description of the average, the data supports it. A 3.7 citywide mean, 48 neighborhoods at 4.0 or better, and a falling reported-crime trend is a genuinely strong profile for a city of San Jose’s size, and no other big Bay Area city matches that combination. As a description of every part of the city, no label survives contact with a 3.5 point spread. The usable version of the safest-big-city claim is a sorting instruction rather than a verdict: the further you get from the downtown core and the closer to the foothill and southwest belts, the higher the scores run, and the ranking table tells you exactly how high, neighborhood by neighborhood.
How we scored it
Houseberry scores 112 San Jose neighborhoods on a 0 to 5 safety scale built from reported incident data normalized by population, alongside school, amenities, and other factor scores. Figures cited are as of August 4, 2026 and update as new data lands. Median price fields for San Jose neighborhoods were not published on the ranking page at the time of this pull, so this piece makes no price claims. The full live table is on the San Jose safety ranking.
Checking a specific part of the city? Open the San Jose map and click into any neighborhood for its complete scorecard.
All information provided on this website including but not limited to - school ratings, safety, amenities, user opinions, and property data - is for general informational purposes only. We do not guarantee its reliability, accuracy, or completeness. Users should independently verify information and consult appropriate professionals as needed. By using this website, you agree Houseberry is not responsible for actions, decisions, or consequences arising from reliance on the information provided
houseberry.com - CA DRE# 01847391
 Bay East ©2025. CCAR ©2025. bridgeMLS ©2025. Information Deemed Reliable But Not Guaranteed. This information is being provided by the Bay East MLS, or CCAR MLS, or bridgeMLS. The listings presented here may or may not be listed by the Broker/Agent operating this website. This information is intended for the personal use of consumers and may not be used for any purpose other than to identify prospective properties consumers may be interested in purchasing. Data last updated at September 18, 2026 12:00 AM