That 3,427-home Hayward number is old. Here's what changed
A state filing lists up to 3,427 homes for downtown Hayward, but that is the 2019 plan's ceiling. Here is what the City Council actually changed on October 6, what has been built, and what could move the number.

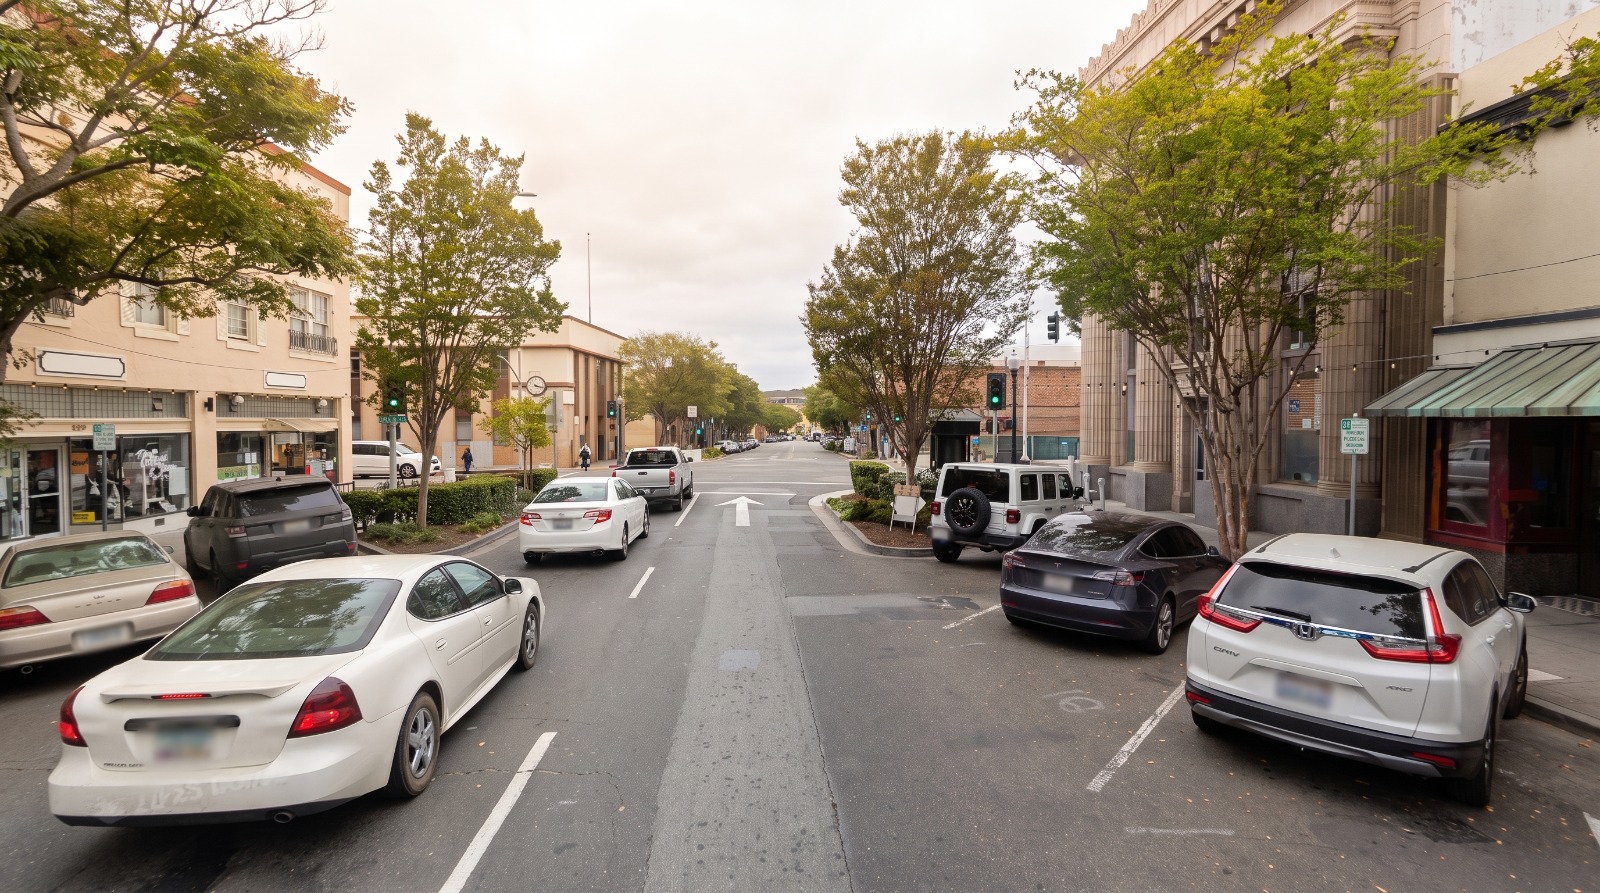
B Street in downtown Hayward lined with two- and three-story storefronts and street trees, looking toward the BART station Photo: Houseberry
A state environmental filing that landed on Tuesday, October 13, lists up to 3,427 new homes and 1.9 million square feet of shops and offices for downtown Hayward. Read quickly, it looks like a fresh plan for a small town's worth of apartments around the BART station.
It is not new. The 3,427 figure is the 20-year ceiling Hayward studied when it adopted its Downtown Specific Plan in April 2019, and the filing reuses that plan's state tracking number. What actually happened is smaller and more useful: on October 6 the City Council voted 7-0 to nearly double how many homes per acre downtown's two densest land-use categories allow, and to fold 130 more lots into them.
Prices downtown have been heading down while the paperwork moved. According to Houseberry's Downtown Hayward data, the typical home there sold for about $648,000 in September 2026, down from about $732,000 in October 2025.
What the October 13 filing actually is
It is a Notice of Determination, the one-page form a California city files after it approves something, so the clock starts on any lawsuit under the state's environmental law. Senior Planner Taylor Richard signed this one on October 8. It describes "General Plan amendments" carrying out two programs already written into the 2019 plan, and it checks the boxes for an environmental impact report, mitigation measures and a statement of overriding considerations.
Those boxes point back to 2019. The draft resolution relies on the plan's original environmental review, certified with Resolution 19-075 on April 30, 2019, and finds the amendments involve "no new or unanticipated levels of development." The state's CEQAnet project page still shows the 2018 project description, which is where the 3,427 homes and 1.9 million square feet come from. That same description lists 7,539 new residents and 6,333 jobs as the 20-year projection.
So the honest headline is a correction. Nobody filed for 3,427 homes this week. The city adjusted its long-range map to match the plan it already had.
What the council changed on October 6
We previewed this vote in our look at the downtown density hearing. Here is how it came out.
| What changed | Before October 6 | After October 6 |
|---|---|---|
| Density range, City Center categories | No minimum, up to 110 homes per acre | 34.8 to 210 homes per acre |
| Lots in the City Center-Retail and Office Commercial category | Existing downtown core | Plus 130 lots from four other categories |
| Uses and building forms | Set by the 2019 plan | Unchanged |
The 130 lots come from Commercial/High Density Residential, Medium Density Residential, Sustainable Mixed Use, and a Parks and Recreation strip between Mission Boulevard and A Street. The minimum dropped from the 40 the Planning Commission saw in August to 34.8, after developers asked staff for a floor that reflects the market.
Why bother, if no project is attached? The staff report names three reasons. The Metropolitan Transportation Commission's Transit-Oriented Communities Policy, adopted in March 2026, ties future regional grant money to density near stations, and the next round of those One Bay Area Grants is $820 million for 2027 through 2030. The state's SB 79 transit housing law took effect July 1, 2026. And BART is planning housing on its own downtown lots. Staff also admitted the two programs were due around 2024 and slipped because of staffing.
The numbers people are mixing up
Several big figures are floating around downtown Hayward, and only a few describe buildings.
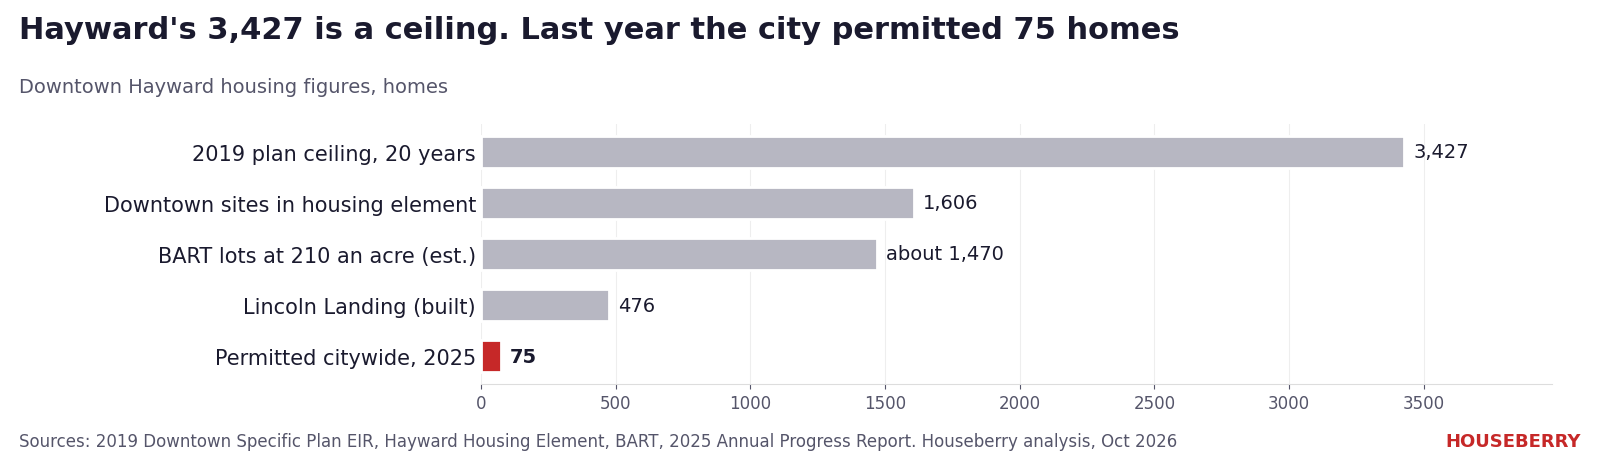
The 3,427 is the plan's ceiling. The 1,606 is how many homes Hayward's housing element counted on 29 downtown sites covering 19.63 acres, at the old 110-homes-per-acre cap. About 1,470 is our own calculation of what BART's three downtown lots, about 7 acres combined, could hold at 210 homes an acre. That is the paper maximum. At the new 34.8 floor, the same lots would need at least about 244.
The 476 is real. Lincoln Landing, the apartment and retail complex on the old Mervyns headquarters site at 22301 Foothill Boulevard, broke ground in September 2019. It was approved in 2017, two years before the downtown plan existed. Maple and Main, the A Street complex approved the same year, appears in the housing element at 314 homes with an estimated 2026 finish. The element also lists 155 homes at 1200 A Street, 80 at 603 A Street and 41 at 4th and B. We could not confirm which of those three have been built.
The 75 is the one that matters most. According to Hayward's 2025 annual progress report, that is how many homes the whole city permitted last year, a drop the report pins on the economy. By our count, Hayward permitted about 802 homes from 2023 through 2025, roughly 17 percent of the 4,624 its state housing target calls for by 2031.
What downtown looks like on the ground
Downtown Hayward scores 2.7 out of 5 overall on Houseberry and ranks 16th of 20 Hayward neighborhoods, with amenities at 4.0 and safety at 1.9. The typical home there is about 27 percent cheaper than the city as a whole. Houseberry's Hayward data puts the citywide typical home at about $891,000 in September 2026, down about 3 percent in a year. Downtown fell about 11 percent over the same stretch.
Up the hill east of Foothill, Upper B Street was about $793,000, down about 2 percent.
BART is the piece that could change those numbers. Its draft rules for the three station lots, shown at an April open house, allow 40 to 210 homes an acre, buildings up to 11 stories, at least 20 percent affordable and no more than half a parking space per home. Weekday ridership at the station has fallen by half, from about 5,000 in 2019 to about 2,500 in 2025. No developer has been picked and no unit count has been published. Across downtown on Foothill, the lot where the old City Center tower stood until 2020 is still empty.
The cap was never the problem
We think the council got this right. A 210 cap matches what BART is already showing the public, keeps Hayward eligible for grant money it would otherwise lose, and costs neighbors nothing they had before.
But nobody should mistake permission for buildings. Downtown Hayward has had zoning for 11-story buildings near BART since 2019, and the city permitted 75 homes in all of 2025. The 3,427 number was a ceiling seven years ago and it is still a ceiling. What would move it is a signed BART development deal, and that request for proposals does not have a date yet.
If you are weighing downtown against the quieter hills around it, our Hayward neighborhood ranking lines up all 20 neighborhoods on price, safety and schools, before any tower gets a groundbreaking date.
Sources
- CEQAnet: Hayward Downtown Specific Plan Implementation, Notice of Determination
- CEQAnet: Hayward Downtown Specific Plan project page
- Hayward City Council, PH 26-039 staff report
- Hayward Legistar: PH 26-039 legislative record
- City of Hayward: Downtown Specific Plan
- Hayward Housing Element, Appendix C housing resources
- BART: Downtown Hayward station development open house boards
- Hoodline on BART's Hayward station plans
The Houseberry Research Team is Houseberry's reporting team: Bay Area real estate analysts, data specialists and longtime local market watchers. Every day we check the public record: building permits, city council and planning agendas, county recorder filings, state housing bills, police incident data and school results. Then we tie each story to what it means for specific neighborhoods, using Houseberry's own neighborhood data on prices, appreciation, safety, schools and amenities. Questions or corrections: Contact us.
Map of Hayward Neighborhoods
Loading map...
View Full Map
Top Neighborhoods in Hayward, CA



All information provided on this website including but not limited to - school ratings, safety, amenities, user opinions, and property data - is for general informational purposes only. We do not guarantee its reliability, accuracy, or completeness. Users should independently verify information and consult appropriate professionals as needed. By using this website, you agree Houseberry is not responsible for actions, decisions, or consequences arising from reliance on the information provided
houseberry.com - CA DRE# 01847391
 Bay East ©2025. CCAR ©2025. bridgeMLS ©2025. Information Deemed Reliable But Not Guaranteed. This information is being provided by the Bay East MLS, or CCAR MLS, or bridgeMLS. The listings presented here may or may not be listed by the Broker/Agent operating this website. This information is intended for the personal use of consumers and may not be used for any purpose other than to identify prospective properties consumers may be interested in purchasing. Data last updated at October 18, 2026 12:00 AM