San Francisco eviction notices are up again. Here's where
We counted every eviction notice San Francisco landlords filed from January through October 2026, by neighborhood and by reason. The total barely rose. Where the notices landed, and why, changed a lot.

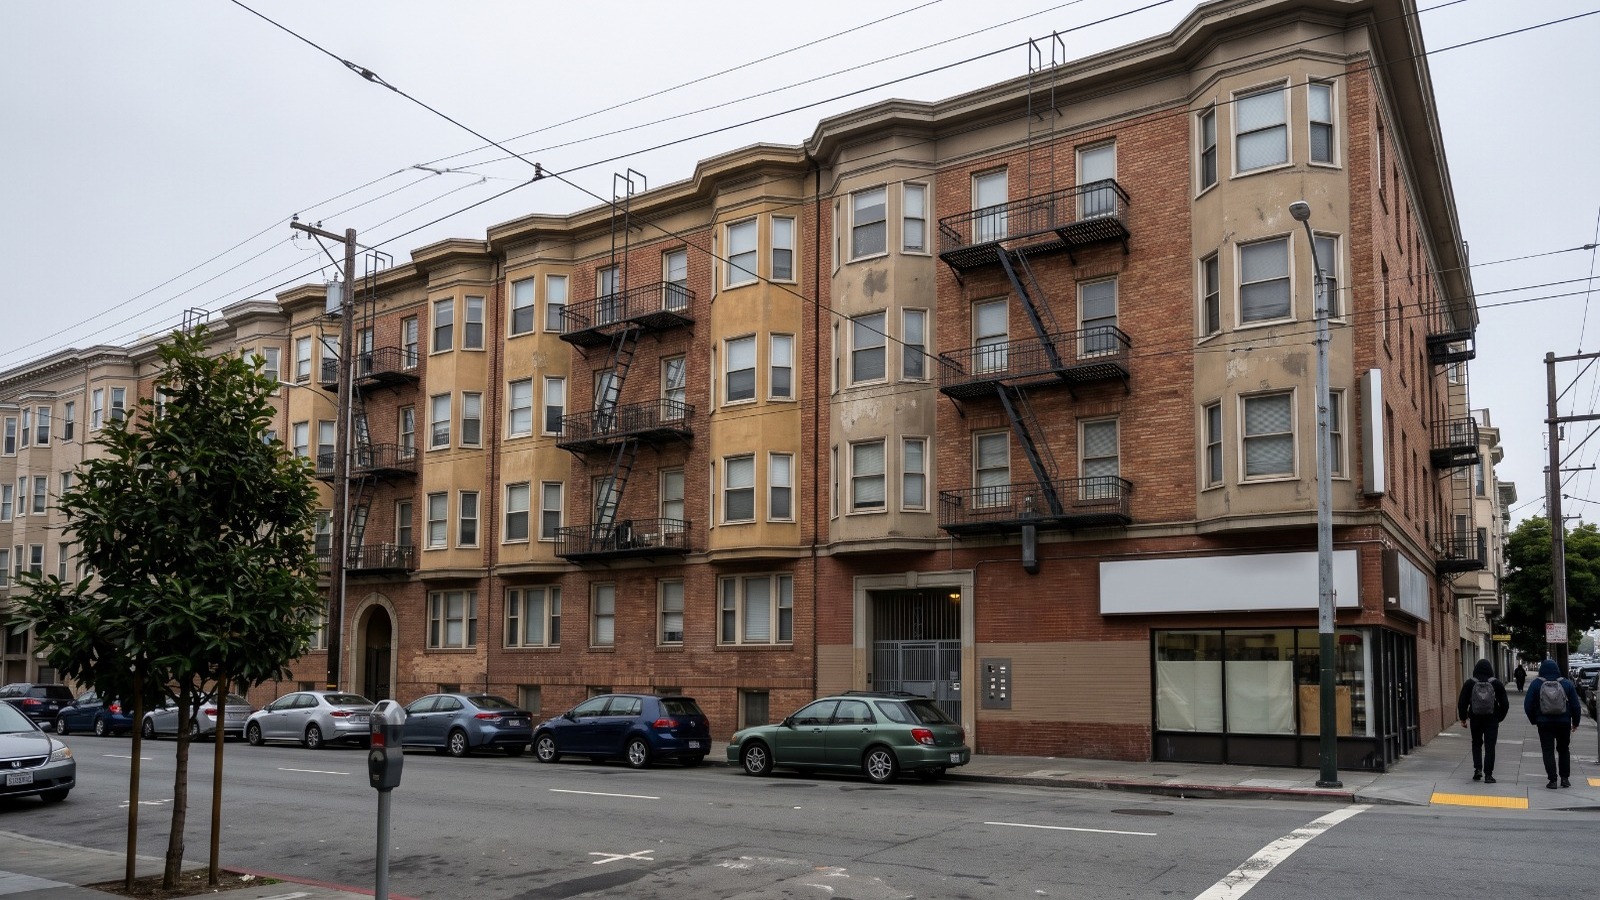
AI-generated view of early-1900s brick apartment buildings with fire escapes on O'Farrell Street in the Tenderloin Photo: Houseberry
San Francisco landlords filed 1,350 eviction notices with the Rent Board in the first ten months of 2026. That is 4 percent more than the same stretch of 2025 and 84 percent more than 2024, when the January-through-October count was 735.
We pulled every notice from the city's eviction notice dataset and counted them by neighborhood and by reason. The citywide number barely moved this year. Where the notices landed moved a lot, and so did why landlords filed them.
A notice is not an eviction. The Rent Board's own annual report says many notices never end with a tenant leaving, and landlords are not required to file notices for unpaid rent, so those are undercounted. Read these as a map of pressure, not of move-outs.
Three neighborhoods that jumped, and why
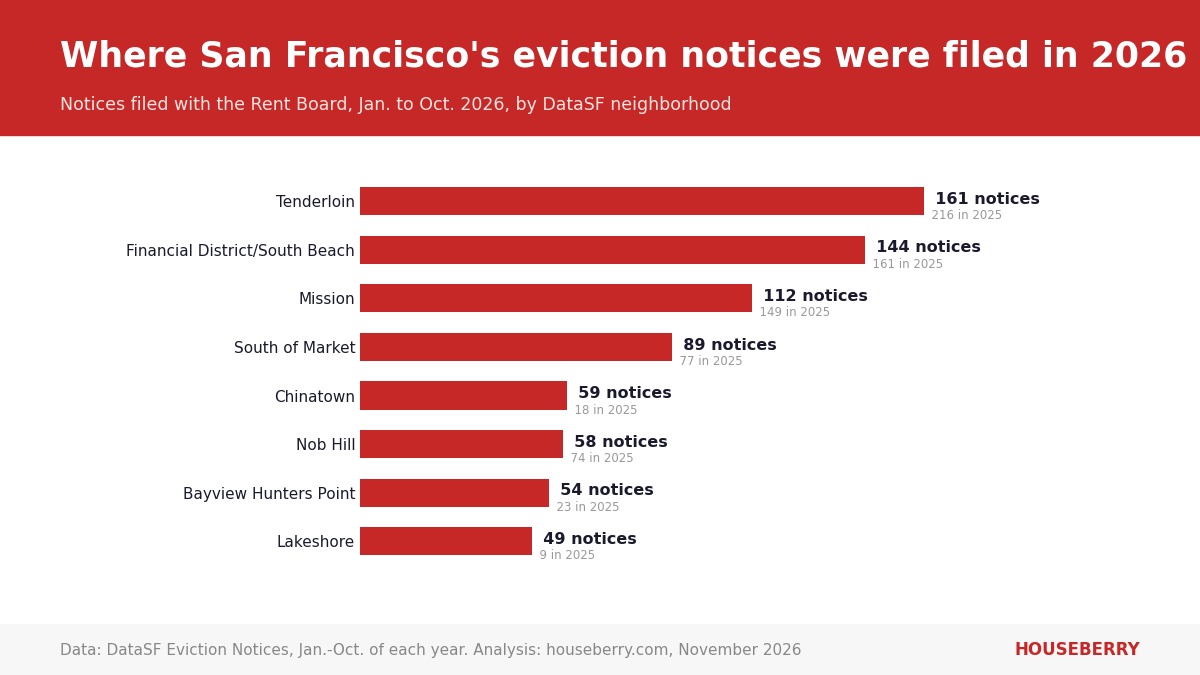
The Tenderloin still leads, but it is down 25 percent, from 216 to 161. The Mission fell from 149 to 112. The big increases were somewhere else, and they mostly trace back to a single block or complex.
Chinatown went from 18 notices to 59. Thirty-nine of them came from the 400 block of Broadway, and 43 of the neighborhood's notices cited a breach of the lease. One block, not a neighborhood trend.
Lakeshore went from 9 to 49. The addresses are Cambon Drive, Arballo Drive, Gonzalez Drive and Font Boulevard, the streets of the Parkmerced apartment complex. Nuisance was the most common reason there.
Bayview Hunters Point went from 23 to 54, with nine from the 800 block of Jamestown Avenue.
The reasons changed more than the totals.
Non-payment notices fell from 438 to 319. Because landlords are not required to file them with the Rent Board, that drop may reflect less filing as much as less nonpayment. Breach of the rental agreement rose from 252 to 390 and nuisance from 313 to 365, and together those two now make up more than half of all notices. Capital improvement notices, the kind filed for major renovations, fell by half, from 89 to 43.
In the Tenderloin, only 19 of 161 notices were for unpaid rent. Seventy-eight were for breach and 51 for nuisance.
Where owners are moving back in
The no-fault notices tell a different story. An owner move-in notice means the owner or a relative wants the unit. An Ellis Act notice means the owner is taking the whole building off the rental market. Those land on the west side and the northern hills, where the buildings are small and the homes are expensive.
By our count, ten neighborhoods from the Marina and Pacific Heights to the Richmond, the Sunset and Noe Valley filed 253 notices this year, 19 percent of the city's total. They filed 53 of the 94 owner move-in notices, 56 percent. The Tenderloin, the Financial District and the Mission together filed 417 notices and only 11 owner move-ins.
The Inner Richmond is the sharpest case. It went from 9 notices to 26, and 10 of those 26 were owner move-ins, the most of any neighborhood. The Sunset and Parkside area had 10 of the city's 34 Ellis Act notices.
That matches what is happening to prices. Houseberry's data has the typical Inner Richmond home at about $2.45 million in September 2026, up 16 percent in a year. When a two-unit building is worth that much more as one owner's home, the rental downstairs is the first thing to go.
Prices are rising fastest where owners move in
| Houseberry neighborhood | Overall rank of 92 | Typical home, Sept. 2026 | 12-month change |
|---|---|---|---|
| Inner Richmond | 12th | $2,450,560 | +16% |
| Noe Valley | 61st | $2,534,690 | +11% |
| Glen Park | 54th | $2,112,379 | +15% |
| Tenderloin | 92nd | $499,159 | +14% |
The quietest corners of the list are not cheap. Glen Park, with three notices all year, had a typical home of about $2.11 million in September, and Noe Valley, with 14, about $2.53 million, by Houseberry's data.
The table uses Houseberry's neighborhood boundaries, which are smaller than the city's analysis neighborhoods in the eviction data, so the match is close but not exact. Prices come from each neighborhood's 12-month price history on Houseberry.
We think the useful read here is about the kind of notice, not the count. A breach or nuisance notice in a large building is a dispute a tenant can fight. An owner move-in notice in a two-flat in the Richmond usually ends with the tenant gone, and it is the kind rising fastest where prices are rising fastest.
If you are renting a unit in a small building on the west side, ask whether the owner lives elsewhere and plans to stay there. If you are buying a building with a tenant in it, know that a move-in eviction comes with relocation payments and requires the owner or relative to live there for at least 36 continuous months, under the city's rent law.
Every San Francisco neighborhood's scores and price trend are on Houseberry's San Francisco ranking, and the Tenderloin page shows the city's lowest-ranked neighborhood still rose 14 percent in price this year.
Sources
- DataSF: Eviction Notices dataset, notices through Oct. 29, 2026, pulled Nov. 13, 2026
- San Francisco Rent Board: Annual Eviction Report, March 2025 to February 2026
- San Francisco Rent Board: evictions based on owner or relative move-in
The Houseberry Research Team is Houseberry's reporting team: Bay Area real estate analysts, data specialists and longtime local market watchers. Every day we check the public record: building permits, city council and planning agendas, county recorder filings, state housing bills, police incident data and school results. Then we tie each story to what it means for specific neighborhoods, using Houseberry's own neighborhood data on prices, appreciation, safety, schools and amenities. Questions or corrections: Contact us.
Map of San Francisco Neighborhoods
Loading map...
View Full Map
Top Neighborhoods in San Francisco, CA





All information provided on this website including but not limited to - school ratings, safety, amenities, user opinions, and property data - is for general informational purposes only. We do not guarantee its reliability, accuracy, or completeness. Users should independently verify information and consult appropriate professionals as needed. By using this website, you agree Houseberry is not responsible for actions, decisions, or consequences arising from reliance on the information provided
houseberry.com - CA DRE# 01847391
 Bay East ©2025. CCAR ©2025. bridgeMLS ©2025. Information Deemed Reliable But Not Guaranteed. This information is being provided by the Bay East MLS, or CCAR MLS, or bridgeMLS. The listings presented here may or may not be listed by the Broker/Agent operating this website. This information is intended for the personal use of consumers and may not be used for any purpose other than to identify prospective properties consumers may be interested in purchasing. Data last updated at November 18, 2026 12:00 AM