San Francisco Public Land for Housing: 147 Sites by District
A new Budget and Legislative Analyst report flags 147 publicly owned properties that could help house San Francisco. We sorted every one by district, and the west side holds more than you might think.
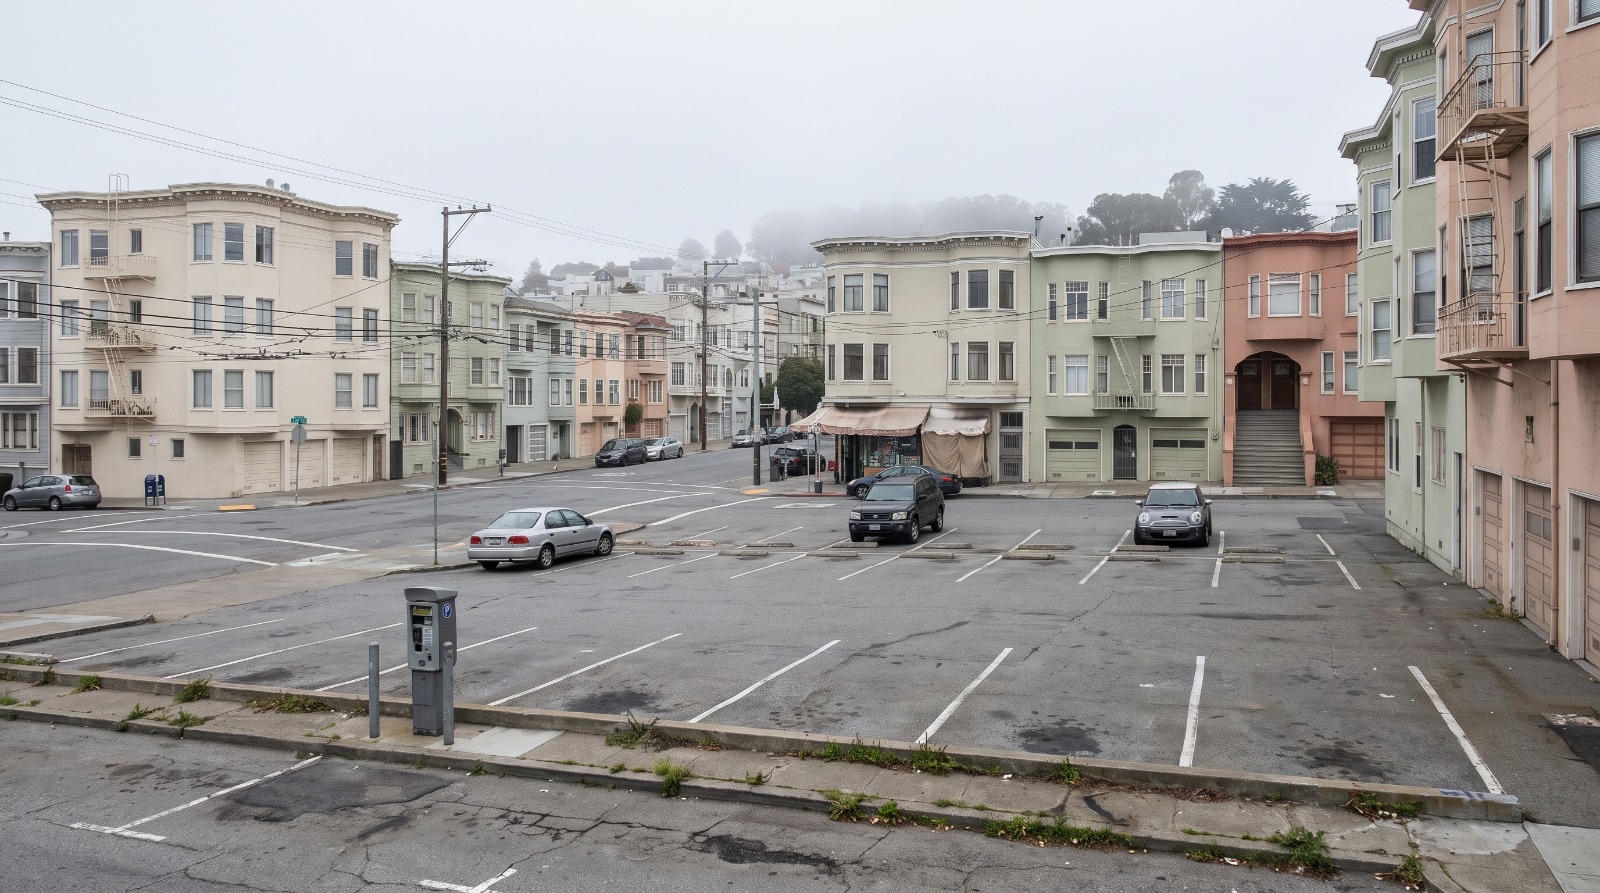
A city-owned surface parking lot in San Francisco's Inner Richmond ringed by flats, the kind of public land for housing the new report flags. Photo: Houseberry
San Francisco finished 405 new homes in the first half of 2026, and the pipeline behind them is drying up. Project applications filed September 1 to 28 proposed just 30 net new homes, the fewest for that stretch of September since 2012. On September 29, the Board of Supervisors' own analysts released a report showing the city is sitting on 147 publicly owned properties that could help change that number, from Muni parking lots in the Richmond to a seismically unsafe office tower at 170 Otis Street. We went through the report's appendices property by property and sorted all 147 by supervisorial district, so you can see which San Francisco neighborhoods hold the public land.
The short answer: the waterfront districts lead on paper, but most of those sites are Port piers that state law makes hard to build homes on. Take the Port out and the district with the most public land in play is District 7, west of Twin Peaks, with 19 sites.
Who did this work, and why it matters
This analysis belongs to the Board of Supervisors' Budget and Legislative Analyst's Office. Its policy analysis report, Opportunities for Using Vacant, Underutilized, Surplus, and other Public Properties for Housing and other Public Purposes, is dated September 29, 2026, was requested by Supervisor Danny Sauter, and lists Fred Brousseau and Daniela Estrada as project staff. Everything in this post that counts or describes a site comes from their appendices. The district tally and the neighborhood lens are ours.
It is a bigger piece of work than the headline suggests. The analysts reviewed land held by 28 city agencies plus the school district and City College. They screened for four things: seismically unsafe or poor-condition buildings, parking lots and garages, vacant or soon-to-be-vacant property, and parcels where the current building uses only part of the lot.
They had to go looking because nobody else was. A 2002 ordinance asks departments to report their own surplus land every year. The report found that no department submitted a single new surplus property for eight straight years, from fiscal 2017-18 through 2025-26. And the agencies that control the most land, including the Port, Muni, Rec and Park and the school district, are exempt from that law entirely.
The San Francisco Standard's Maggie Angst and the Chronicle's Alyce McFadden covered the report the morning it came out, and both are worth reading for Sauter's side of it.
The 147 sites, district by district
Here is the count by supervisorial district, straight from the report's Appendix A (44 vacant or soon-to-be-vacant properties) and Appendix B (103 properties with development or joint-use potential).
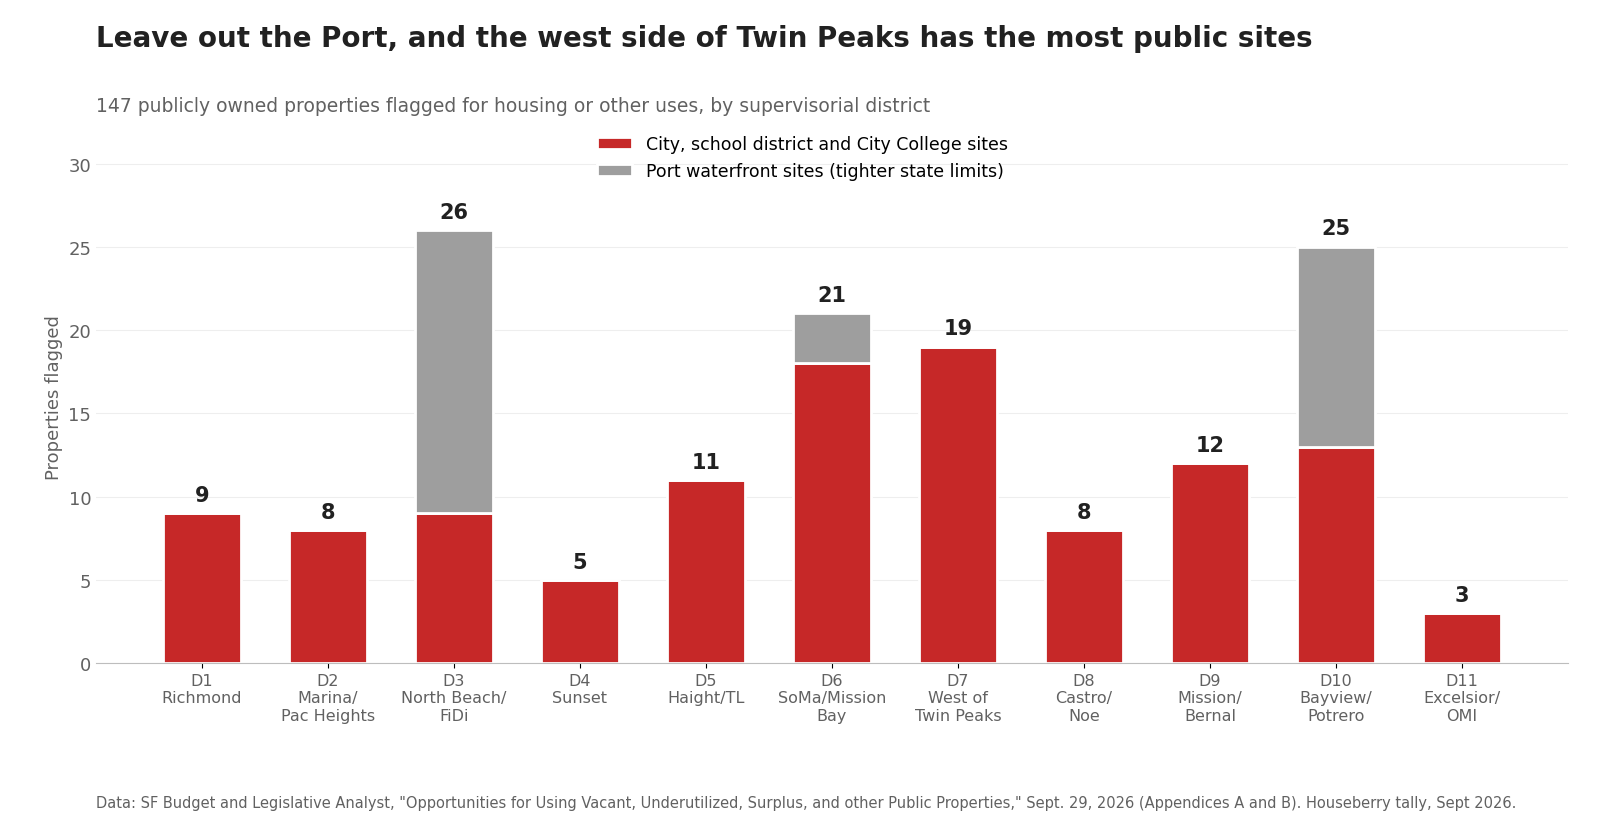
Two things jump out. First, the Port's 32 properties sit almost entirely in District 3 (17, the northeast waterfront from Fisherman's Wharf to South Beach) and District 10 (12, the southern piers around Pier 80 and Pier 96). The report is candid that direct waterfront land falls under the state's Public Trust Doctrine, which bars most non-maritime uses. Seawall lots back from the water are a different story, but a vacant pier shed is not a housing site in any near-term sense.
Second, the west side shows up far more than its reputation would suggest. District 7 alone has 19 properties, and District 1 (Richmond) and District 4 (Sunset) add 14 more. That matters because the west side is where most of the city's recent rezoning for taller buildings is aimed, and its public land is mostly the easiest kind to reuse: small surface parking lots.
The west side's secret inventory is Muni parking lots
Ten of the fourteen neighborhood Muni surface lots in the report sit in Districts 1, 4 and 7. These are the lots you have parked in without thinking about who owns them: 8th and Clement and 9th and Clement in the Inner Richmond, 18th and Geary and 21st and Geary further out, 8th and Irving and 20th and Irving in the Sunset, West Portal at 14th Avenue, and Claremont and Ulloa up the hill.
None of them is huge. The biggest, Claremont and Ulloa, is about 12,900 square feet. But they sit a block or two from the L, N and K lines and the Geary buses, in neighborhoods like the Inner Richmond and West Portal that score well on schools and safety and where a typical home runs about $2.45 million and $2.62 million respectively, per Houseberry's September 2026 figures. Small lot, great location, expensive neighborhood. That is the kind of site where housing built over retained parking has its best shot at penciling out.
The report also notes that SFMTA already reviewed about 90 of its own properties under a joint development program adopted last year and is ranking them with a consultant. So the lots are not news to Muni. What is new is seeing them listed next to everything else the city owns.
Nine sites, about 1,812 homes
The analysts only put unit estimates on a handful of properties, and they call those estimates illustrative. Still, they are the most concrete numbers in the report.
| Site | Neighborhood (district) | What is there now | Est. homes |
|---|---|---|---|
| 200 Middle Point Road | Hunters Point (D10) | Vacant school district land | 633 |
| 1620 7th Avenue | Inner Sunset (D7) | Vacant school district land | 412 |
| 170 Otis Street | Hayes Valley and Mission edge (D6) | Human Services Agency HQ, moving out by 2029 | 272 |
| 20 Cook Street | Laurel Heights (D2) | School district offices | 216 |
| 95 Gough Street | Hayes Valley (D6) | School district offices | 115 |
| Tenderloin Children's Recreation Center | Tenderloin (D5) | Rec center, housing above | 61 |
| Mission Recreation Center | Mission (D9) | Rec center, housing above | 38 |
| Richmond Recreation Center | Central Richmond (D1) | Rec center, housing above | 34 |
| Bernal Heights Recreation Center | Bernal Heights (D9) | Rec center, housing above | 31 |
Add those up and you get 1,812 homes on nine parcels. For scale, that is more than four times the 405 homes San Francisco actually finished in the first half of this year, a figure we dug into in our look at why the city's housing pipeline built just 400 homes. The pipeline holds tens of thousands of proposed homes that are not getting built, and new proposals have slowed to a trickle. Public land cannot fix that by itself, but it removes one cost from the equation.
The two biggest numbers belong to the school district, which ran its own portfolio study in May. The 7th Avenue lot sits on the hill above the Inner Sunset's Irving Street strip and has been floated for years as educator housing. Middle Point Road is on the edge of Hunters Point near India Basin, where a typical home in Hunters Point runs about $724,000, one of the lowest figures in the city.
The honest catch: land is the cheap part
Here is where the report is refreshingly blunt. Land is only about 10 percent of what it costs to build an affordable home in San Francisco, roughly $121,000 of a total that now runs about $1 million per two-bedroom unit, according to Planning Department figures the analysts cite. More than 12,600 affordable units across 59 projects are already sitting in the pipeline waiting for funding. At the city's current pace of about 650 fully affordable units a year, clearing that backlog alone would take more than a decade.
So a free parcel does not build itself. That is why the report pushes the city to treat its land as a portfolio, selling or leasing sites it does not need and using the proceeds to pay for housing on the sites it keeps. It is also why a mixed-income building on a Muni lot in the Richmond, where market-rate units can carry some of the cost, may move faster than a fully subsidized one.
And the list is a starting point, not a plan. The analysts did not screen out sites with the wrong zoning, historic status or environmental limits. Some of the 147 are working fire stations and libraries. Housing over a rec center would need a charter amendment and a citywide vote.
What this means if you live near one of these sites
For most neighbors, nothing changes soon. This is a screening list, and every site still has to survive a department that may want to keep it, a feasibility study and, often, a rezoning.
But if you are buying on the west side, it is worth knowing where the public lots are, because they are among the few places in those neighborhoods where a five or six story building could appear without anyone losing a home. We think that is a good thing. San Francisco had reached only about 12 percent of its 82,069-home state target by 2025, per the report, and the city's own parking lots are about the least controversial place to start. You can see how each neighborhood scores on schools, safety and price on our San Francisco neighborhood rankings.
The next step is political. Sauter told the Chronicle he has called a hearing at the Land Use and Transportation Committee for early November, where departments will be asked how their property could be used for housing. The report's main recommendation is simple: put one agency in charge. As Sauter put it to the Standard, "Where there's no ownership, that's where things go to die."
Sources
- San Francisco Budget and Legislative Analyst's Office (Fred Brousseau and Daniela Estrada), Opportunities for Using Vacant, Underutilized, Surplus, and other Public Properties for Housing and other Public Purposes, policy analysis report to Supervisor Danny Sauter, September 29, 2026
- Maggie Angst, The San Francisco Standard, SF's housing solution may be hiding in plain sight: Land it already owns, September 29, 2026
- Alyce McFadden, San Francisco Chronicle, Map: These publicly owned properties could become S.F. housing, September 29, 2026
- GrowSF, Only 405 homes built in first half of 2026, July 31, 2026
- Houseberry, San Francisco neighborhood rankings, neighborhood prices as of September 2026
Map of San Francisco Neighborhoods
Loading map...
View Full Map
Top Neighborhoods in San Francisco, CA





All information provided on this website including but not limited to - school ratings, safety, amenities, user opinions, and property data - is for general informational purposes only. We do not guarantee its reliability, accuracy, or completeness. Users should independently verify information and consult appropriate professionals as needed. By using this website, you agree Houseberry is not responsible for actions, decisions, or consequences arising from reliance on the information provided
houseberry.com - CA DRE# 01847391
 Bay East ©2025. CCAR ©2025. bridgeMLS ©2025. Information Deemed Reliable But Not Guaranteed. This information is being provided by the Bay East MLS, or CCAR MLS, or bridgeMLS. The listings presented here may or may not be listed by the Broker/Agent operating this website. This information is intended for the personal use of consumers and may not be used for any purpose other than to identify prospective properties consumers may be interested in purchasing. Data last updated at September 29, 2026 12:00 AM