San Francisco Housing Filings: Lowest September Since 2012
San Francisco project applications filed September 1 to 28, 2026 proposed just 30 net new homes, the fewest since 2012, in the middle of an AI boom that has pushed prices and rents up about 25 percent. Our count of SF Planning records, why builders are sitting out, and where filings still land.
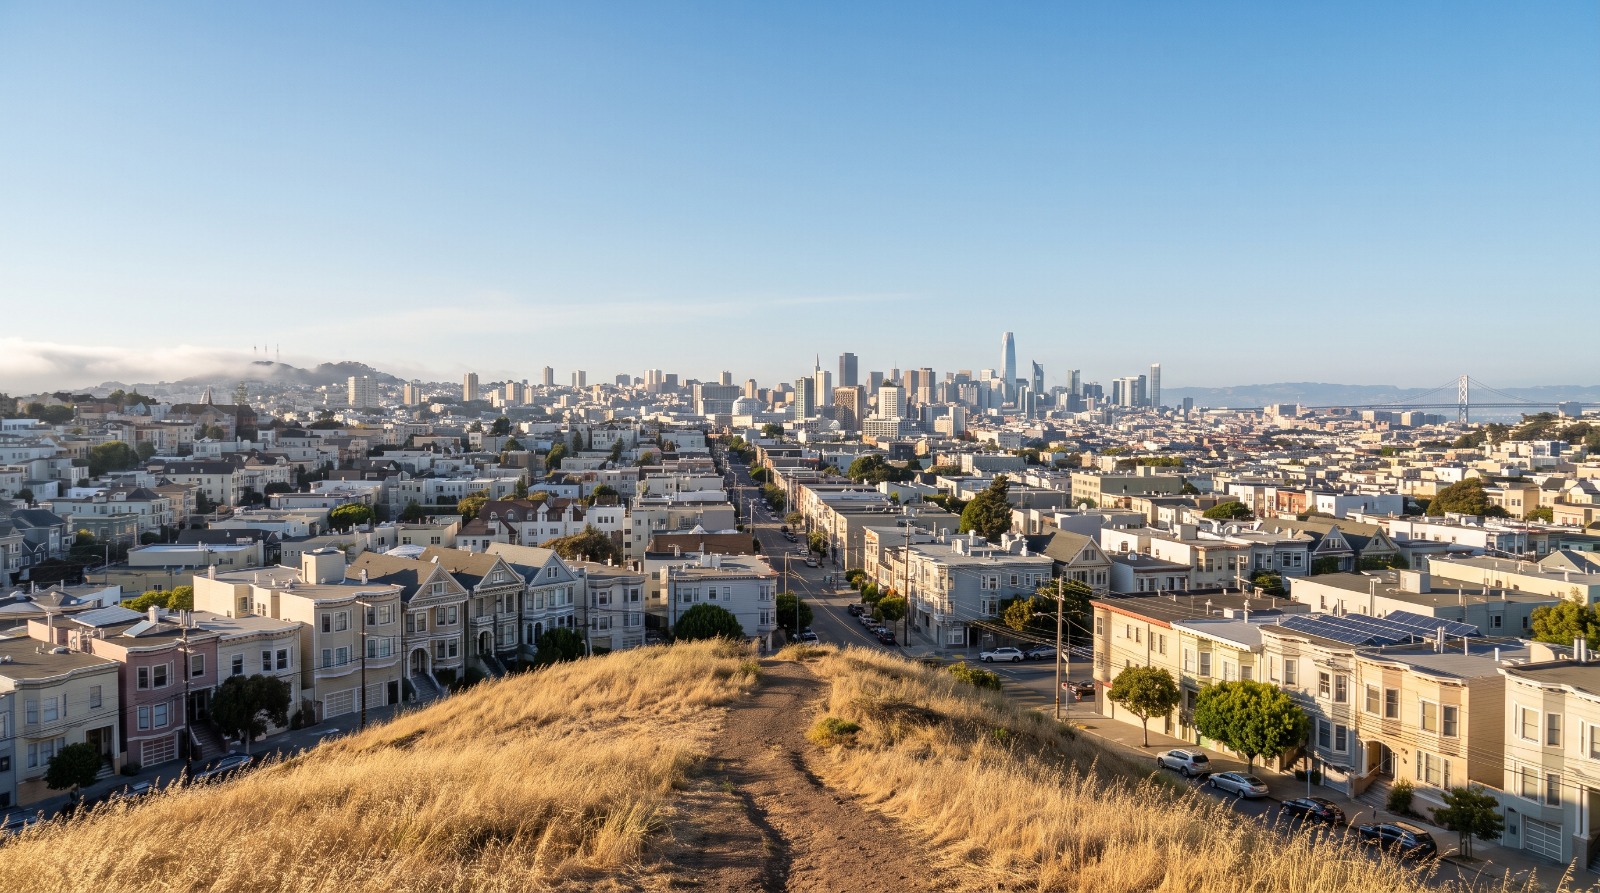
San Francisco skyline from Bernal Heights Hill with no construction cranes, as housing filings hit a 2012 low. Photo: Houseberry
Thirty. That is how many net new homes were proposed in the 70 project applications filed with the San Francisco Planning Department from September 1 to 28, 2026. It is the smallest September total since 2012, when the same stretch of the month produced 11.
And it landed in the same week AMD agreed to pay $8.2 billion for World Labs, a San Francisco AI company, and Zumper reported one-bedroom rents up 25.4 percent in a year. The money is here. The hiring is here. The proposals for new homes are not. We pulled San Francisco housing filings straight from SF Planning's records to check, and the gap between the AI boom and the housing pipeline is wider than the headlines suggest.
Thirty homes, and the biggest filing was five
The largest September application proposes five net new homes. It is at 62-74 Laidley Street in Glen Park, where three lots would be reshuffled into two with a pair of new buildings.
Behind it sits a three-home SB 9 and ADU project at 8 Orizaba Avenue in Oceanview, two-home infill projects on 20th Street in Potrero Hill and on 5th Avenue in the Inner Richmond, and then a long tail of one-unit filings. Some of those singles are brand-new ADUs. Several are legalizations of apartments that already exist, like the unit at 567-579 Lombard Street in North Beach, which puts one more home on the books and zero new roofs on the skyline.
The other 46 applications, about two-thirds of the month, proposed no net change in housing at all. Remodels, additions, storefront work.
How we counted: we took every project application (record type PRJ) in SF Planning's projects dataset on DataSF, grouped them by the date each was opened, and added up the dataset's net-units field, which is proposed homes minus existing homes on the site.
Two caveats before anyone reads this as final. September still has two days left, and applications sometimes get entered late, so the month could rise a bit. To keep the comparison fair, the chart below uses September 1 to 28 for every year. Full-month totals for past Septembers are nearly identical: 277 in 2025, 517 in 2024 and 1,319 in 2022. It would take a single filing of roughly 250 homes in the last two days just to get back to last September.
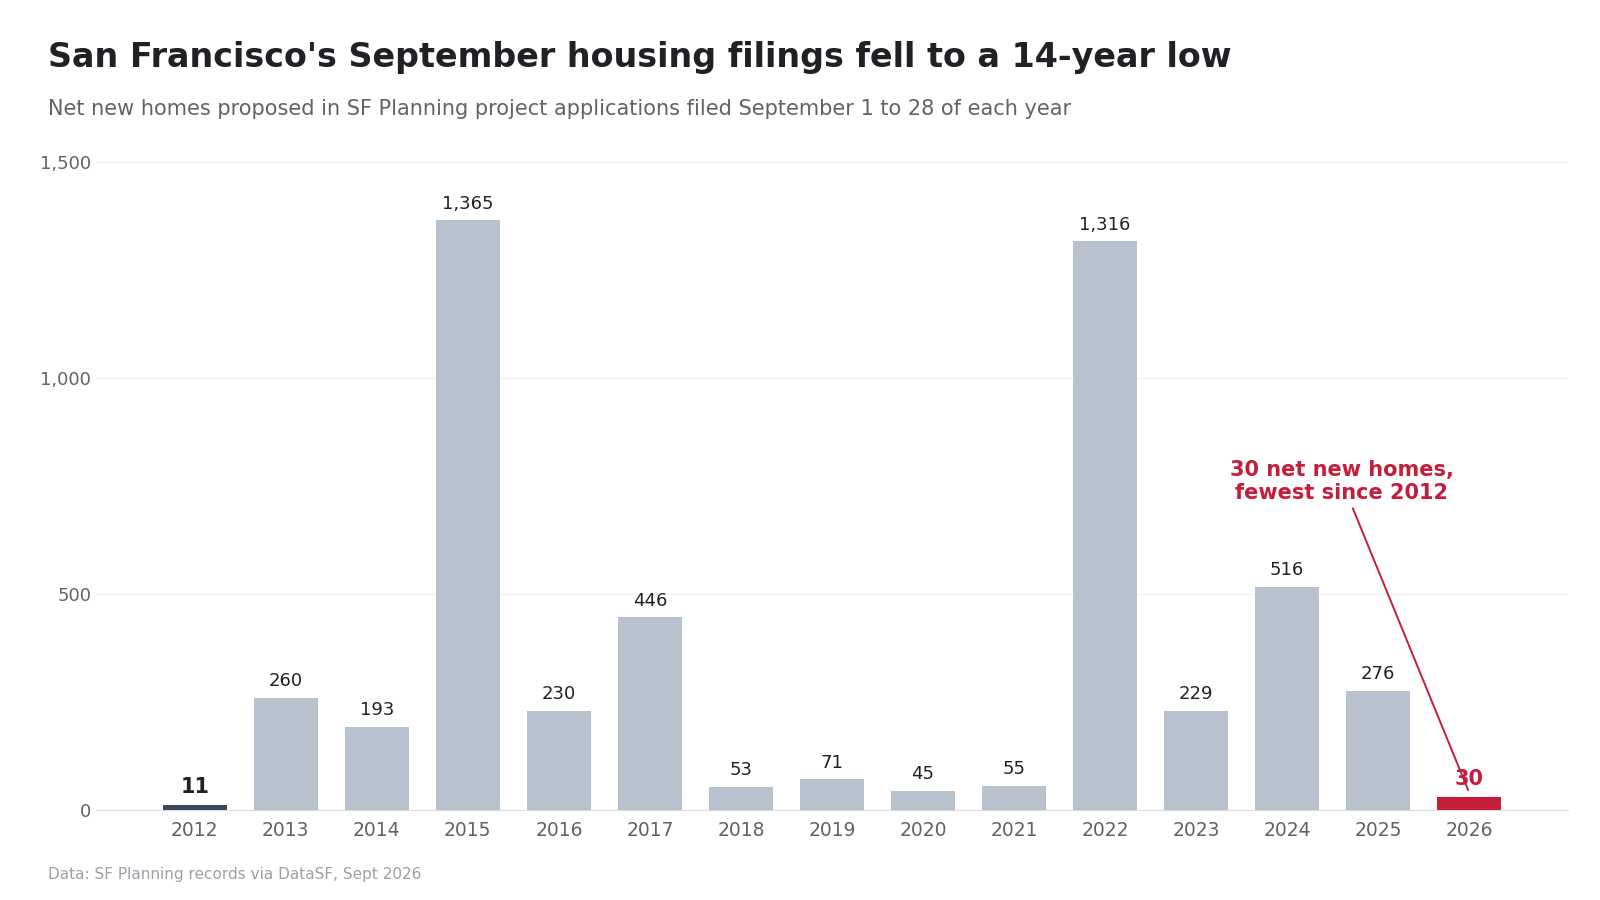
Monthly numbers are lumpy. One big filing can make a September look like 2015 or 2022. But the last time the month came in this low, San Francisco was still climbing out of the foreclosure era. February 2026 also produced only 30 net homes, so September is not a one-off blip in an otherwise busy year.
An AI boom on one side of the ledger, 30 homes on the other
Every demand signal that normally sends developers to Planning is flashing at once. AI companies are expanding, buying and leasing across the city. The Real Deal counted 413 AI tenants in San Francisco offices by August 2026, up from 23 before ChatGPT launched. We mapped where they cluster in our look at the AI office neighborhoods, mostly SoMa and Mission Bay.
Home prices followed. The California Association of Realtors put San Francisco County's median sale price at $1,875,000 in August 2026, up from $1,500,000 a year earlier. Our own city data, which tracks a different mix of sales, shows the San Francisco median at about $2.20 million in August 2026, up from $1.89 million in September 2025.
Rents moved even faster. Zumper's September 2026 report put the median one-bedroom at $4,400, up 25.4 percent, and the median two-bedroom at $6,340, up 26.8 percent, as CBS News reported.
In most cities, a 25 percent jump in rents is the starting gun for a building cycle. In San Francisco this September, it produced 30 homes. That is the story in one number.
Down 51 percent, or 35 percent, depending on one project
The year-to-date drop is real, but one 2025 filing inflates it. From January 1 to September 28, 2026, applicants proposed 2,880 net new homes on 879 applications. Same period of 2025: 5,932 homes on 881 applications. Nearly the same amount of paperwork, half the housing.
But 2025 had 88 Bluxome Street, the 1,500-home proposal on the Mission Bay edge of SoMa filed in May 2025. Take it out and 2025 still had 4,432 net homes, so 2026 trails by 35 percent. 2025 also had 10 South Van Ness Avenue at 1,019 homes. Remove both mega-filings and the gap narrows to about 16 percent. Honest version: 2026 is weaker, but 2025 was carried by a couple of giants.
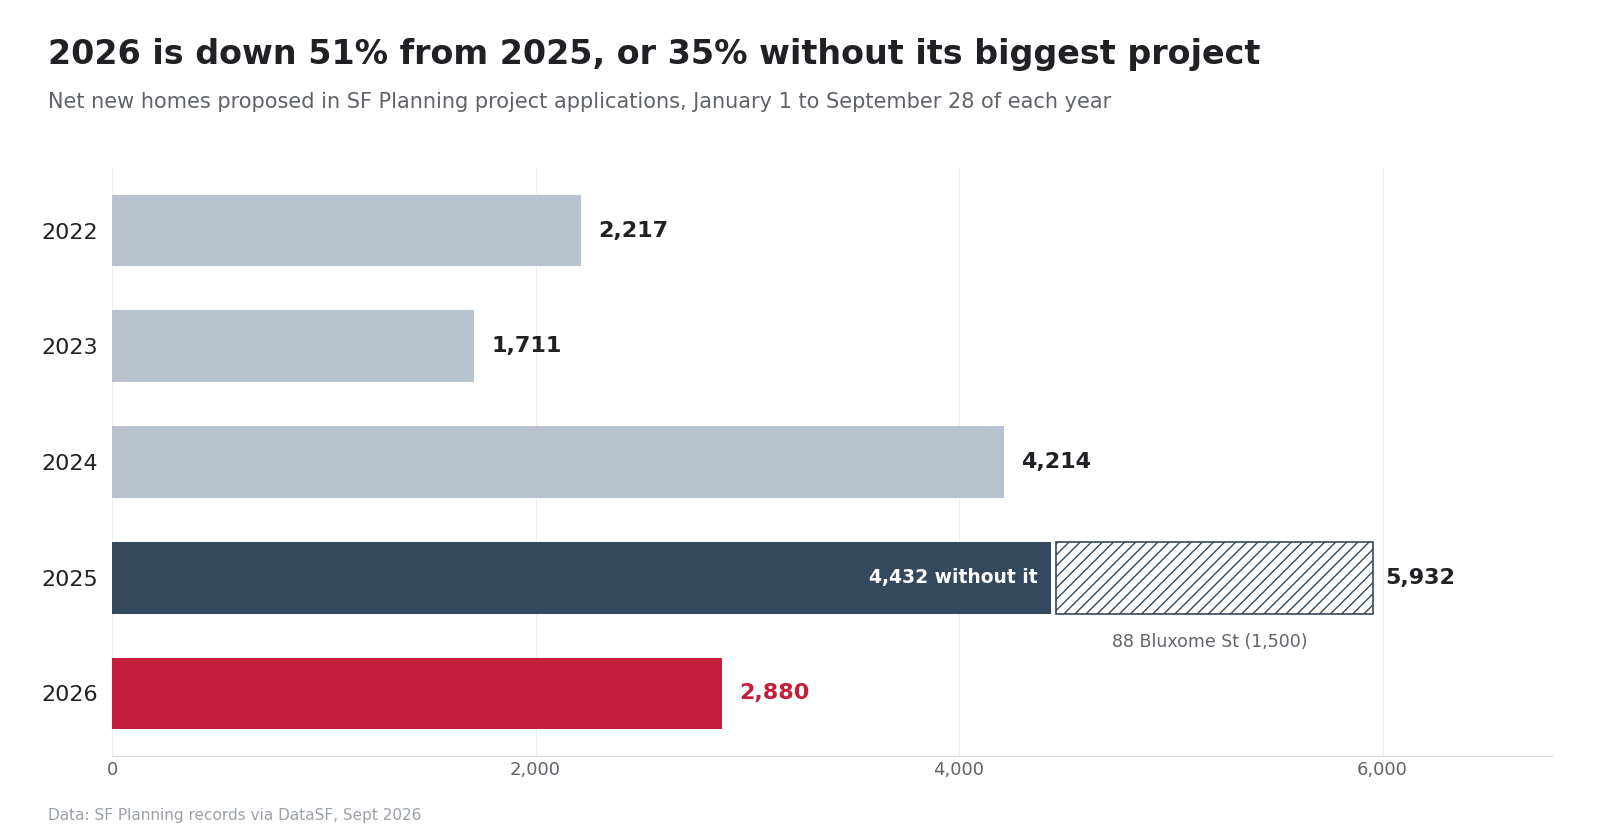
There is a downside to the gloomy read, and it is worth saying plainly. 2026 is still ahead of 2022 (2,217) and 2023 (1,711) for the same months. What makes 2026 look thin is how concentrated it is. Four filings, the Seawall Lot 330 site at 555 Beale Street (568 homes), the Outer Richmond Safeway at 850 La Playa Street (562), 3350 Mission Street (379) and 38 8th Street (288), supplied 1,797 of the year's 2,880 homes. Without them, San Francisco's other 875 applications this year proposed about 1,083 homes combined.
Why is almost nobody proposing new homes in San Francisco?
Because the math on a new building still does not work for most sites, even with rents up a quarter. City Hall has cut costs on paper this year. Filings have not caught up.
- Rates. Freddie Mac's 30-year fixed average was 7.03 percent on September 24, 2026, up from 6.30 percent a year earlier. Construction loans price above that, and a project's buyers or permanent lenders are looking at the same numbers.
- Costs and feasibility. The City Controller's April 2026 study found market-rate development had slowed because of higher rates and construction costs, and warned that affordable requirements "significantly above 0%" would further threaten feasibility, per Mission Local.
- Fees and inclusionary. Supervisors voted 9-2 in July to cut the inclusionary requirement from 15 percent to 5 percent, which we unpacked in our explainer on the 15 to 5 cut. The SF Standard reports impact fees were also cut by two-thirds. Both are months old. A mid-size application takes longer than that to design.
- Zoning. The Family Zoning Plan, signed in December 2025, created room for about 36,000 homes on the north and west sides, though the city's chief economist projected about 14,600 over 20 years, per Multifamily Dive. The first project under it, an eight-story building in the Inner Richmond, was approved in July, the SF Standard reported.
- Rent threshold. Developers quoted by the SF Standard in August said rents need to climb another 15 to 20 percent before many more projects pencil, and projected a building wave 12 to 24 months out if they do.
Meanwhile the state target is not moving. San Francisco owes 82,000 new homes by 2031 and is about 12 percent of the way there, according to a Budget and Legislative Analyst report covered by the SF Standard on September 29, with at least 12,600 affordable units stalled for lack of funding. My read: the policy fixes were real and overdue, and the builders are telling us they are still not enough at 7 percent money.
Where are San Francisco housing filings still landing?
Almost all of 2026's proposed homes sit in a handful of big filings, and they cluster in three parts of town. The dataset has no neighborhood field, so we placed each 2026 filing of 18 or more net homes by its address.
| Area | 2026 filings (18+ homes) | Net homes proposed | Largest filing |
|---|---|---|---|
| SoMa, South Beach, Mid-Market | 3 | 992 | 555 Beale St, Seawall Lot 330 (568) |
| Richmond District | 4 | 752 | 850 La Playa St, Outer Richmond Safeway (562) |
| Mission and Bernal Heights edge | 3 | 435 | 3350 Mission St (379) |
| Laguna Honda and West Portal | 2 | 223 | 375 Laguna Honda Blvd (159) |
| Civic Center and Hayes Valley | 2 | 156 | 150 Hayes St (104) |
| Castro, upper Market | 1 | 29 | 2051 Market St (29) |
| All other 864 applications | 864 | 293 | Mostly 0 to 5 homes each |
The Richmond is the surprise. The Outer Richmond, the fog-belt blocks between Park Presidio and Ocean Beach, scores 3.9 out of 5 on our rankings with a 4.3 for safety and a median of about $1.87 million in August 2026, up 14.7 percent in 12 months. The 562-home Safeway rebuild near La Playa and Cabrillo would be the biggest thing to happen to that part of the west side in decades.
On the Mission side, 3350 Mission would replace the Safeway near 30th Street with a bigger store and 379 apartments, 76 of them affordable. That site backs onto Bernal Heights, where our median hit about $1.81 million in August 2026, up from $1.61 million a year earlier. And the Seawall Lot 330 filing sits in South Beach, the waterfront condo district next to the ballpark, where the median has been flatter at about $1.23 million.
Everywhere else, including the Sunset, Noe Valley, the Marina and Pacific Heights, no 2026 application has proposed more than 17 net homes. The filings there are ADUs, duplexes, lot splits and legalizations.
When will new supply actually show up?
Not soon. A project application is the first step, not the last. After it come entitlements, financing and a construction schedule of two years or more for a mid-rise. That is why San Francisco finished only about 405 homes in the first half of 2026, as we covered in our look at the 400-home pipeline. This is the next chapter of that story. The completions were thin, and the filings that would feed completions in 2029 and 2030 are thinning too.
For renters, that means the next two to three years of supply is mostly what is already under construction. Expect lease renewals to stay tense, especially near the AI office clusters in SoMa and Mission Bay.
For buyers, it means new-construction condos stay scarce and resale competition stays concentrated on the west side, where the Richmond and Sunset rank well on schools and safety. It does not mean prices can only go up. AI hiring can cool faster than a housing pipeline can refill, and a 25 percent year is not a trend line.
What I will be watching: October through December filings. If the developers quoted this summer are right that rising rents will pull projects off the shelf, applications should start climbing before spring. If they do not, the problem is bigger than interest rates. In the meantime, the block matters more than ever, and we keep our San Francisco neighborhood rankings current so you can compare the areas where the new homes are, and are not, coming.
Sources
SF Planning Department, Planning Department Records: Projects (qvu5-m3a2), DataSF, queried September 29, 2026 (analysis by Houseberry)
California Association of Realtors, County Sales and Price Activity, August 2026
CBS News Bay Area, San Francisco one-bedroom rents at record high (Zumper September 2026 report), September 29, 2026
DatacenterDynamics, AMD acquires AI research firm World Labs in all-stock deal worth $8.2bn, September 2026
The Real Deal, Before ChatGPT, San Francisco had 23 AI tenants. It now has 413, August 10, 2026
Freddie Mac, Primary Mortgage Market Survey, Mortgage Rates Average 7.03%, September 24, 2026
Mission Local, San Francisco drops affordable housing requirement from 15% to 5%, July 15, 2026
The San Francisco Standard, San Francisco developers project a building boom, August 24, 2026
The San Francisco Standard, SF's housing solution may be hiding in plain sight (Budget and Legislative Analyst report), September 29, 2026
Multifamily Dive, San Francisco's new zoning opens the door for more housing, December 2025
Houseberry, San Francisco city guide and neighborhood pages (Outer Richmond, Bernal Heights, South Beach), retrieved September 29, 2026
Map of San Francisco Neighborhoods
Loading map...
View Full Map
Top Neighborhoods in San Francisco, CA





All information provided on this website including but not limited to - school ratings, safety, amenities, user opinions, and property data - is for general informational purposes only. We do not guarantee its reliability, accuracy, or completeness. Users should independently verify information and consult appropriate professionals as needed. By using this website, you agree Houseberry is not responsible for actions, decisions, or consequences arising from reliance on the information provided
houseberry.com - CA DRE# 01847391
 Bay East ©2025. CCAR ©2025. bridgeMLS ©2025. Information Deemed Reliable But Not Guaranteed. This information is being provided by the Bay East MLS, or CCAR MLS, or bridgeMLS. The listings presented here may or may not be listed by the Broker/Agent operating this website. This information is intended for the personal use of consumers and may not be used for any purpose other than to identify prospective properties consumers may be interested in purchasing. Data last updated at September 29, 2026 12:00 AM