San Jose's record household bills hide what buyers pay now
San Jose households pay the most in bills of any big US city, yet Sacramento gives up a bigger share of its income. We ran the numbers for buyers in both cities.

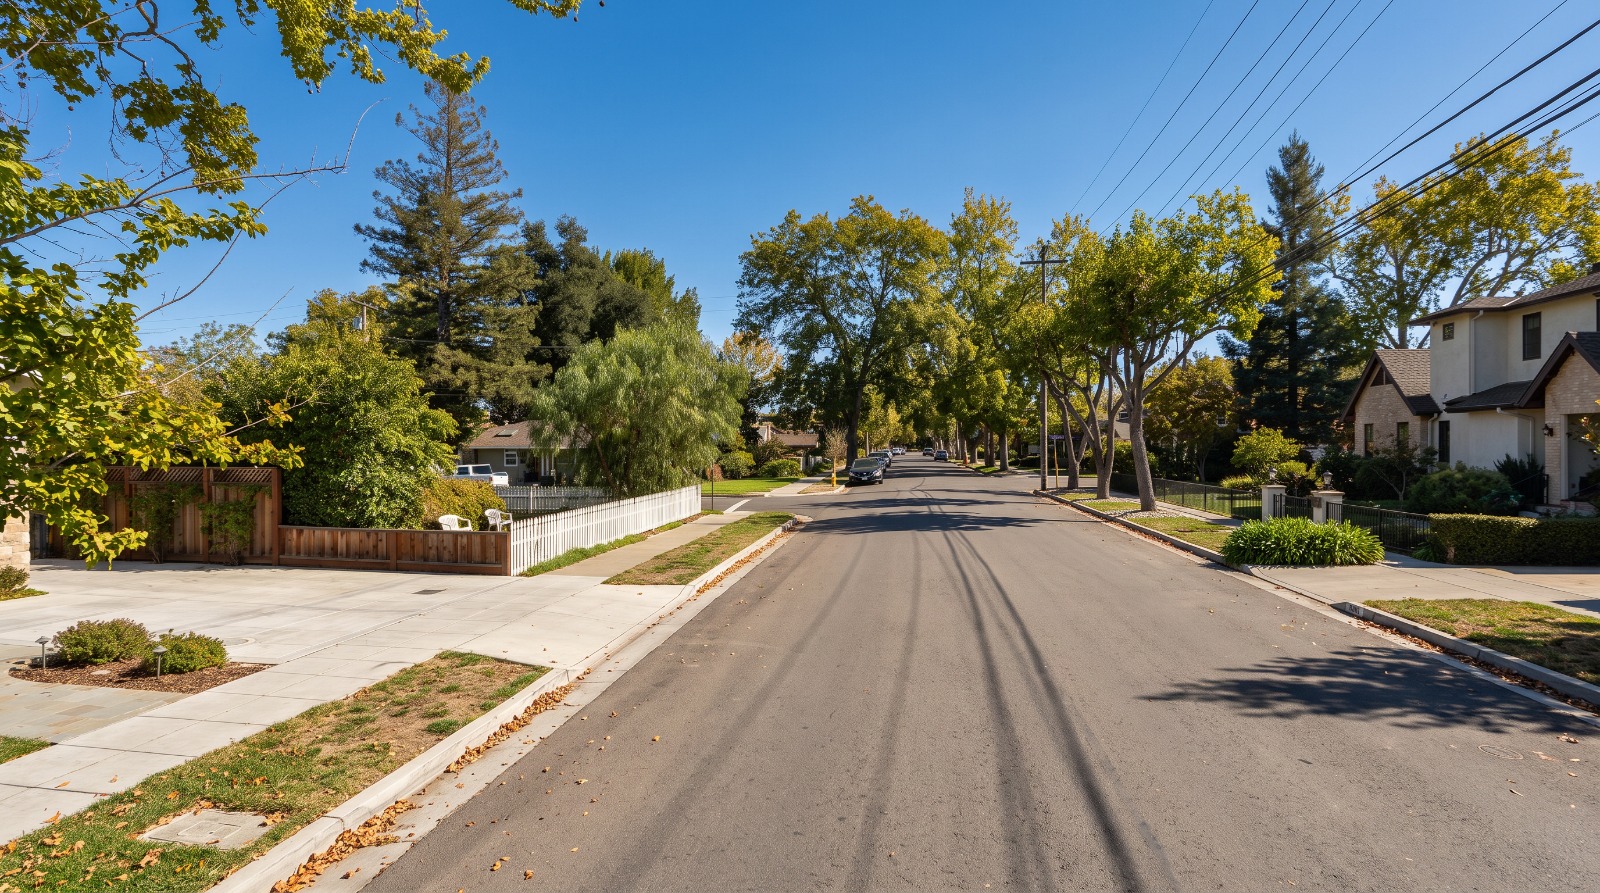
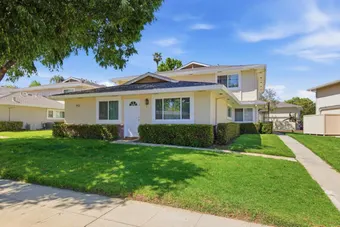
AI-rendered view of Newport Avenue in Willow Glen, San Jose, under hard midday sun, a residential street of two-story homes and utility lines Photo: Houseberry
San Jose households spend a median $44,947 a year on 13 basic bills, $3,746 a month, the highest of the 50 largest cities in the country. That is 78 percent above the national median of $25,266, according to a new doxoINSIGHTS report first covered by San Jose Spotlight on Oct. 21.
Sacramento came in 21st at $27,412. Here is the twist. Those bills eat 34 percent of the typical Sacramento household's income, and only 31 percent in San Jose.
So which city is really more expensive? It depends on whether you already live there. The doxo figures track what people are paying today, mortgages locked in years ago included. A buyer shopping now pays today's price, and Houseberry's San Jose city page puts the typical San Jose home at about $1.42 million in September 2026.
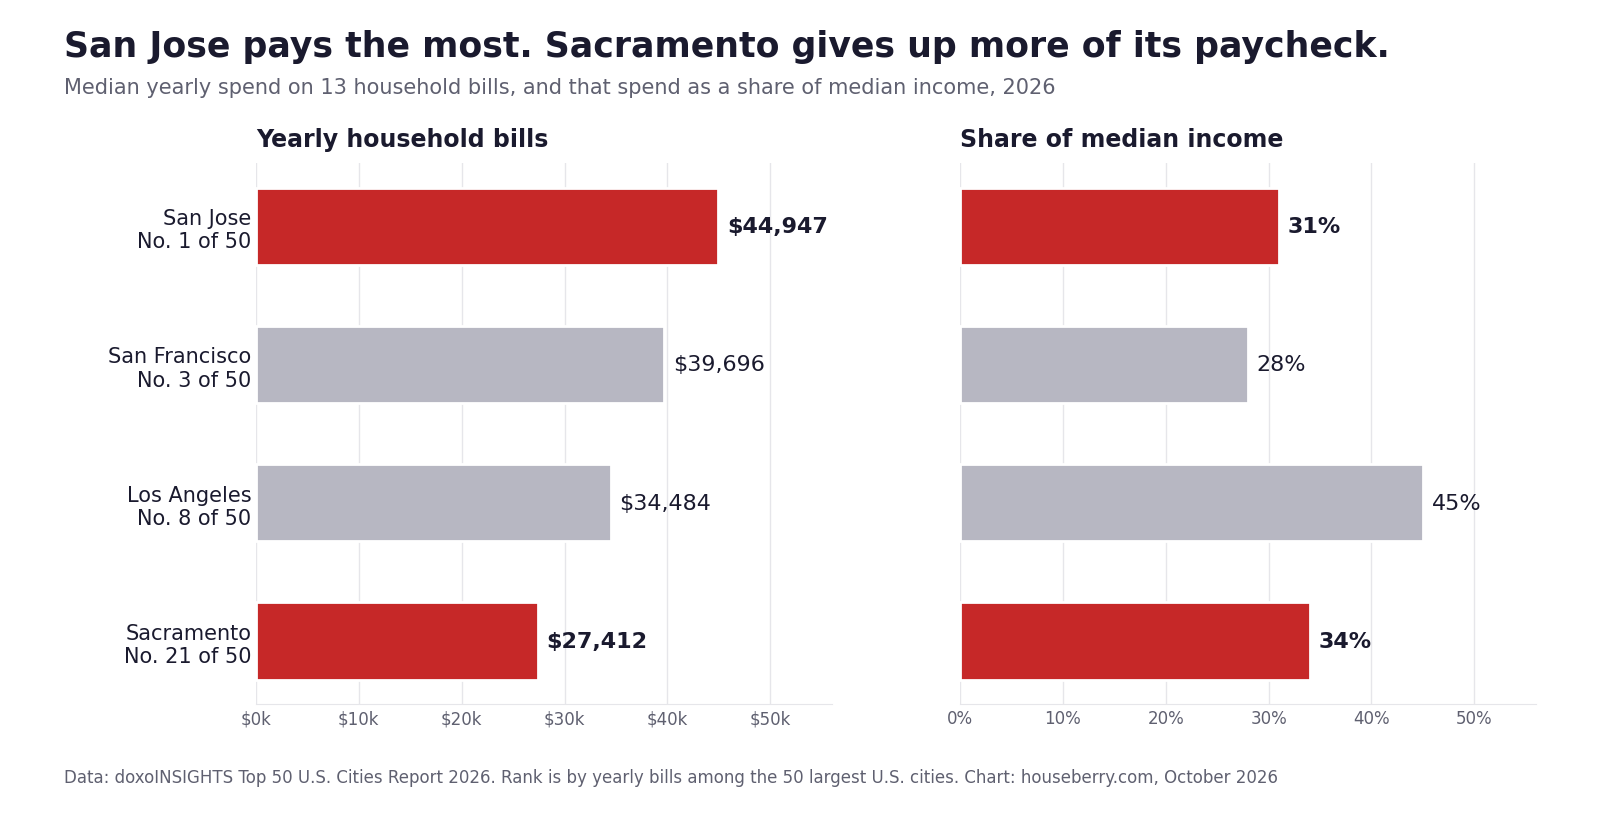
Bigger bills, smaller share, and what is in them
The share number is a ratio, and San Jose wins it on the bottom half. Divide each city's bills by its share and you get the median income doxo is working from: roughly $145,000 in San Jose and about $80,600 in Sacramento. Rounded percentages make those estimates, not census figures, but the gap is real.
San Jose pays $17,535 more a year in bills than Sacramento, and it also earns about $64,000 more, which is the whole trick. After the bills clear, the San Jose household has about $8,340 a month left and the Sacramento household about $4,430.
Measured by share, San Jose sits among the dozen least squeezed of the 50 cities, tied with Seattle and Washington, D.C. Los Angeles is the California outlier. Its households spend 45 percent of income on the same 13 bills, and Detroit tops the whole list at 51 percent.
The 13 bills are mortgage, rent, auto loan, gas, electric, water and sewer, trash and recycling, auto insurance, cable and satellite, health insurance, mobile phone, home security and life insurance. Employer-paid health coverage and taxes are left out, and so is credit card debt.
Strip out housing and San Jose still ranks first, at $16,329 a year, 47 percent above the national median, San Jose Spotlight reported. Three lines stand out against the national median. Auto insurance runs 208 percent higher. Water and sewer runs 121 percent higher, and trash pickup 115 percent higher.
Subtract the non-housing bills from the total and the median San Jose household's housing line comes to about $28,618 a year. That is about $2,385 a month.
Hold on to that number.
The buyer's bill is a different number
Here is where the ranking stops describing anyone house hunting. We ran the payment on each city's typical home at Freddie Mac's 7.40 percent average 30-year rate for the week of Oct. 15, with 20 percent down and a 1.1 percent property tax.
| City | Typical home | Down payment | Monthly loan payment | Plus property tax | Share of median income |
|---|---|---|---|---|---|
| San Jose | $1,422,305 | $284,461 | $7,878 | $9,182 | 76% |
| Sacramento | $494,720 | $98,944 | $2,740 | $3,194 | 48% |
| San Francisco | $2,195,631 | $439,126 | $12,162 | $14,174 | 120% |
Home prices come from Houseberry's city pages: September 2026 for San Jose and San Francisco, and the October 2026 typical price on Houseberry's Sacramento city page. Income shares use the median incomes implied by the doxo report, and leave out insurance, utilities and every other bill.
Read across the San Jose row. The new loan payment of $7,878 is about 3.3 times the $2,385 housing line the median San Jose household pays now. That gap is the story the bill ranking cannot see. Michael O'Connell, a San Jose resident since 1960, told San Jose Spotlight his mortgage is about $1,100 a month. His neighbors who bought last year are paying several times that.
In Sacramento the same math lands at 48 percent of median income. Hard, and still within reach of a two-income household.
We think the share ranking is the right yardstick for people who already own in San Jose and the wrong one for anyone shopping. For a buyer, San Jose is the far more expensive city, and it is not close.
The share number does describe real strain. A Sacramento household with $53,000 left after bills has less room for a car repair or a rent increase than a San Jose household with $100,000, even if the San Jose bills are bigger. Renters in Sacramento feel that first, because rent sits inside the 34 percent and resets every lease.
San Jose is not easy for renters either. In the 2026 Silicon Valley Poll from Joint Venture Silicon Valley, 48 percent of residents said they cannot cover monthly costs while also saving, according to San Jose Spotlight.
Where the prices are moving
The gap is not standing still. Houseberry's price history shows San Jose's typical home slipping from $1,440,208 in October 2025 to $1,422,305 in September 2026, down 1.2 percent. San Francisco went the other way, from $1,887,091 to $2,195,631, up 16.3 percent over the same 12 months.
San Jose's cheapest priced neighborhood on Houseberry, Alexander, had a typical home of about $607,183 in September 2026. That is still about $112,000 above Sacramento's citywide typical price. On the San Jose rankings, none of the 109 priced neighborhoods comes in under Sacramento's typical home.
For buyers weighing a move up Interstate 80, our guide to moving to Sacramento from the Bay Area walks through what the money buys, and our list of the cheapest Bay Area places to live that are actually safe covers the options closer in. If San Jose is still the plan, start with the San Jose neighborhood rankings, which score all 112 neighborhoods on safety, schools and price, and look for the ones where $1.42 million buys the most.
Sources
The Houseberry Research Team is Houseberry's reporting team: Bay Area real estate analysts, data specialists and longtime local market watchers. Every day we check the public record: building permits, city council and planning agendas, county recorder filings, state housing bills, police incident data and school results. Then we tie each story to what it means for specific neighborhoods, using Houseberry's own neighborhood data on prices, appreciation, safety, schools and amenities. Questions or corrections: Contact us.
Map of San Jose Neighborhoods
Loading map...
View Full Map
Top Neighborhoods in San Jose, CA


All information provided on this website including but not limited to - school ratings, safety, amenities, user opinions, and property data - is for general informational purposes only. We do not guarantee its reliability, accuracy, or completeness. Users should independently verify information and consult appropriate professionals as needed. By using this website, you agree Houseberry is not responsible for actions, decisions, or consequences arising from reliance on the information provided
houseberry.com - CA DRE# 01847391
 Bay East ©2025. CCAR ©2025. bridgeMLS ©2025. Information Deemed Reliable But Not Guaranteed. This information is being provided by the Bay East MLS, or CCAR MLS, or bridgeMLS. The listings presented here may or may not be listed by the Broker/Agent operating this website. This information is intended for the personal use of consumers and may not be used for any purpose other than to identify prospective properties consumers may be interested in purchasing. Data last updated at October 22, 2026 12:00 AM